Part 1: Introduction to Plotting
Plotting with matplotlib
In CS111, we will use Python’s matplotlib library to make plots/graphs/charts.
Reference materials:
We'll need to import these modules whenever we want to plot:
import matplotlib.pyplot as plt
import numpy as np
Line plots
plt.figure(figsize=(3,3))
plt.plot([10, 20, 15])
plt.show()
Draw the plot here:
Note: plot allows you to specify the following:
color = 'r'linestyle = 'dashed'linewidth = 5
plt.figure(figsize=(3, 3))
plt.plot([1, 3, 5, 7, 9], [5, 1, 3, 1, 5], color='r', linewidth=4)
plt.show()
Draw the plot here:
Controlling axes with axis/xlim/ylim
x = [1, 3, 5, 7, 9]
y = [5, 1, 3, 1, 5]
plt.figure(figsize=(3, 3))
plt.plot(x, y, 'r-.', lw=5) # shortcut for red dash-dot line, linewidth 5
plt.axis([0, 10, 0, 6]) # list with xmin, xmax, ymin, ymax
plt.show()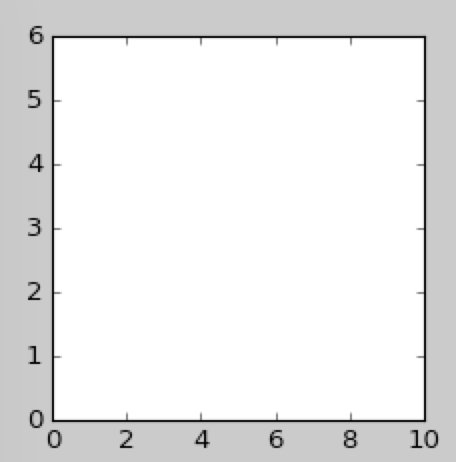
x = [1, 3, 5, 7, 9]
y = [5, 1, 3, 1, 5]
plt.figure(figsize=(3, 3))
plt.plot(x, y, 'c:', lw=3) # cyan dotted line, linewidth 3
plt.ylim((-10, 10)) # tuple
plt.show()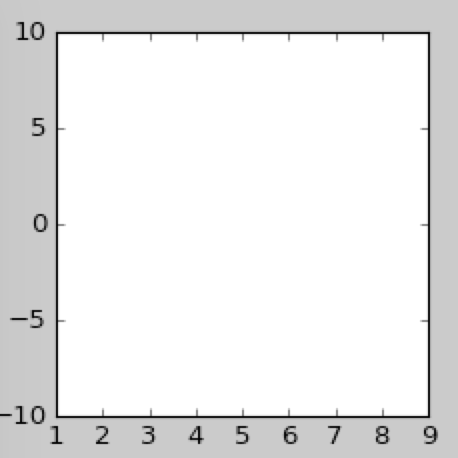
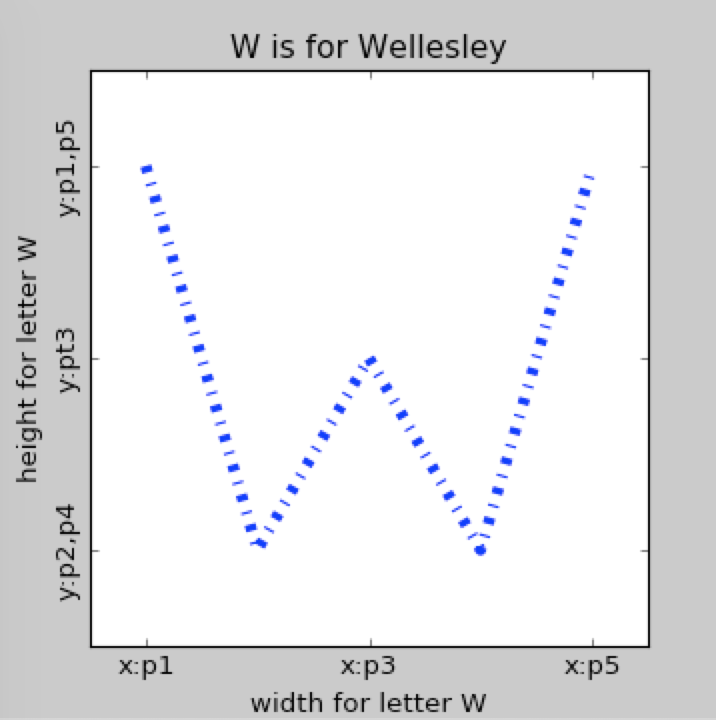
Adding descriptive text to plot (title, axis & tick labels)
plt.figure(figsize=(4.5, 4.5))
plt.plot(x, y, 'b-.', lw=5)
plt.axis([0, 10, 0, 6])
plt.xticks([1, 5, 9],
['x:p1', 'x:p3', 'x:p5'])
plt.yticks([5, 3, 1],
['y:p1,p5', 'y:pt3', 'y:p2,p4'],
rotation=90)
plt.xlabel("width for letter W")
plt.ylabel("height for letter W")
plt.title("W is for Wellesley", fontsize=14)
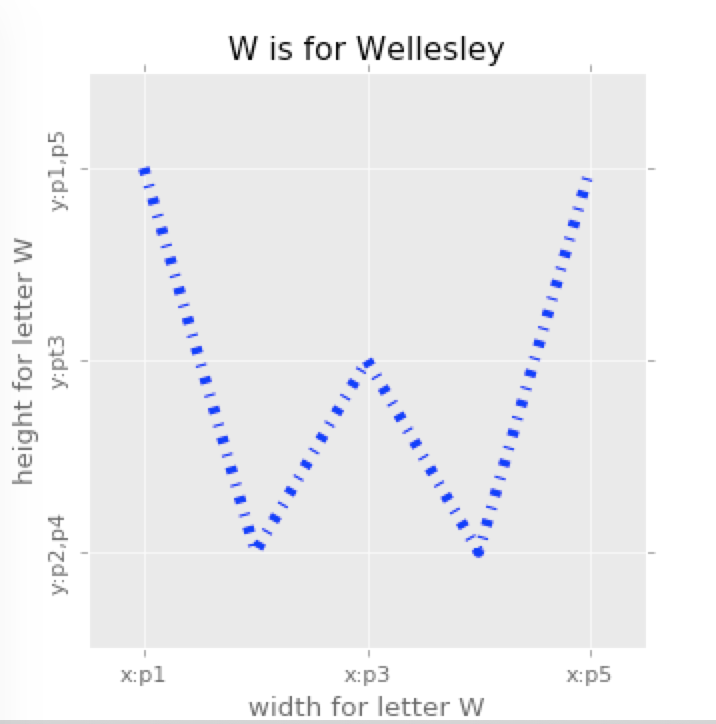
plt.show()Pre-defined style sheets
Examples in our slide reference use ggplot.
plt.style.use('ggplot')Interested in other style sheets? Here is a visual matplotlib style sheet reference.
| No style sheet | ggplot stylesheet |
|
|
Table of Contents
- How to Plot Home
- Part 1: Intro to plotting
- Part 2: Baby name bar plots
- Part 3: Candy Power Rankings
- Part 4: Baby name pie charts
- Reference: matplotlib colors
- Reference: Simple bar chart examples
- Reference: How to make a pie chart
- Reference: Plotting examples