Part 2: Plotting Baby Name data
In this part of lab, we are working with a subset of data from the US SSA (Social Security Administration, which tracks names of babies born in the US.
Set up for plotting
Running your plotting code in Canopy places your plots in the inline Python window.
To have your plots pop up in a separate window, do this:
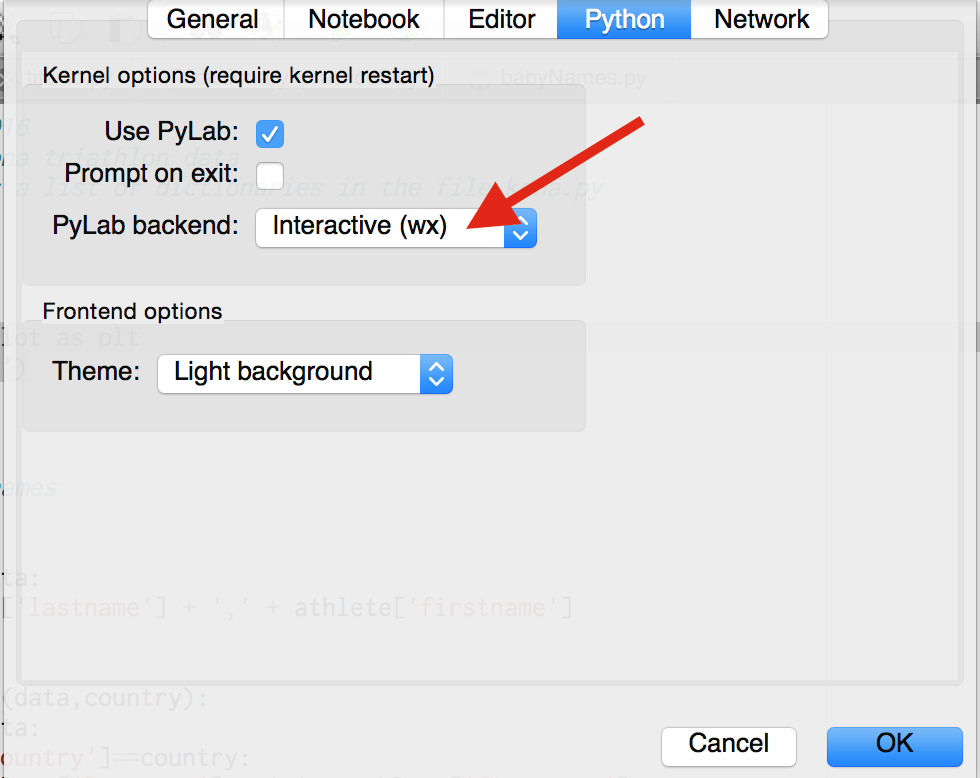
- Canopy > Preferences...
- Click on the Python tab
- In the PyLab backend drop-down menu, select Interactive (wx)
Task 0. Familiarize yourself with the data
In your plotting folder there is a provided file called topNamesData.py that contains 6 variables. Each variable contains a list of tuples with the number of babies born that year and the name. The variables are named year<XXXX><S> where <XXXX> is one of the following years: 1950, 1980 or 2000 and <S> is either F for female or M for male. (To keep things simple, we are only working with these 6 variables in this part of lab).
The variable year1950F contains the number of female babies born in 1950 with the top 10 most popular names.
year1950F = [(80412, 'Linda'),
 (65443, 'Mary'),
 (47920, 'Patricia'),
 (41560, 'Barbara'),
 (38019, 'Susan'),
 (29618, 'Nancy'),
 (29074, 'Deborah'),
 (28885, 'Sandra'),
 (26159, 'Carol'),
 (25693, 'Kathleen')]
Simiarly, the variable year1950M contains the number of male babies born in 1950 with the top 10 most popular names.
year1950M = [(86139, 'James'),
 (83534, 'Robert'),
 (79396, 'John'),
 (65141, 'Michael'),
 (60704, 'David'),
 (60699, 'William'),
 (50969, 'Richard'),
 (45608, 'Thomas'),
 (39107, 'Charles'),
 (33726, 'Gary')]
Create a new file called babynames.py— at the top of this file import topNamesData so you can use the pre-defined lists of tuples.:
from topNamesData import *Task 1. Plot bar charts of counts of the names
Write a function called makePlot1 that will take a list of tuples and produce a plot as shown.
Consider the variable year1950F: to make a bar chart, the names (e.g. Linda, Mary, Patricia, etc) must be separated from their respective counts (e.g. 80412, 65443, 47920, etc).
Extract what you need to plot
Given the list of tuples in year1950F, figure out how to extract the counts into a list of counts. Hint: a list comprehension would work.
To make a horizontal bar chart, you will need to plot numbers against numbers.
Here is a simple plot of the female baby names in 1950.
Goal: Get a plot to show up
makePlot1(year1950F)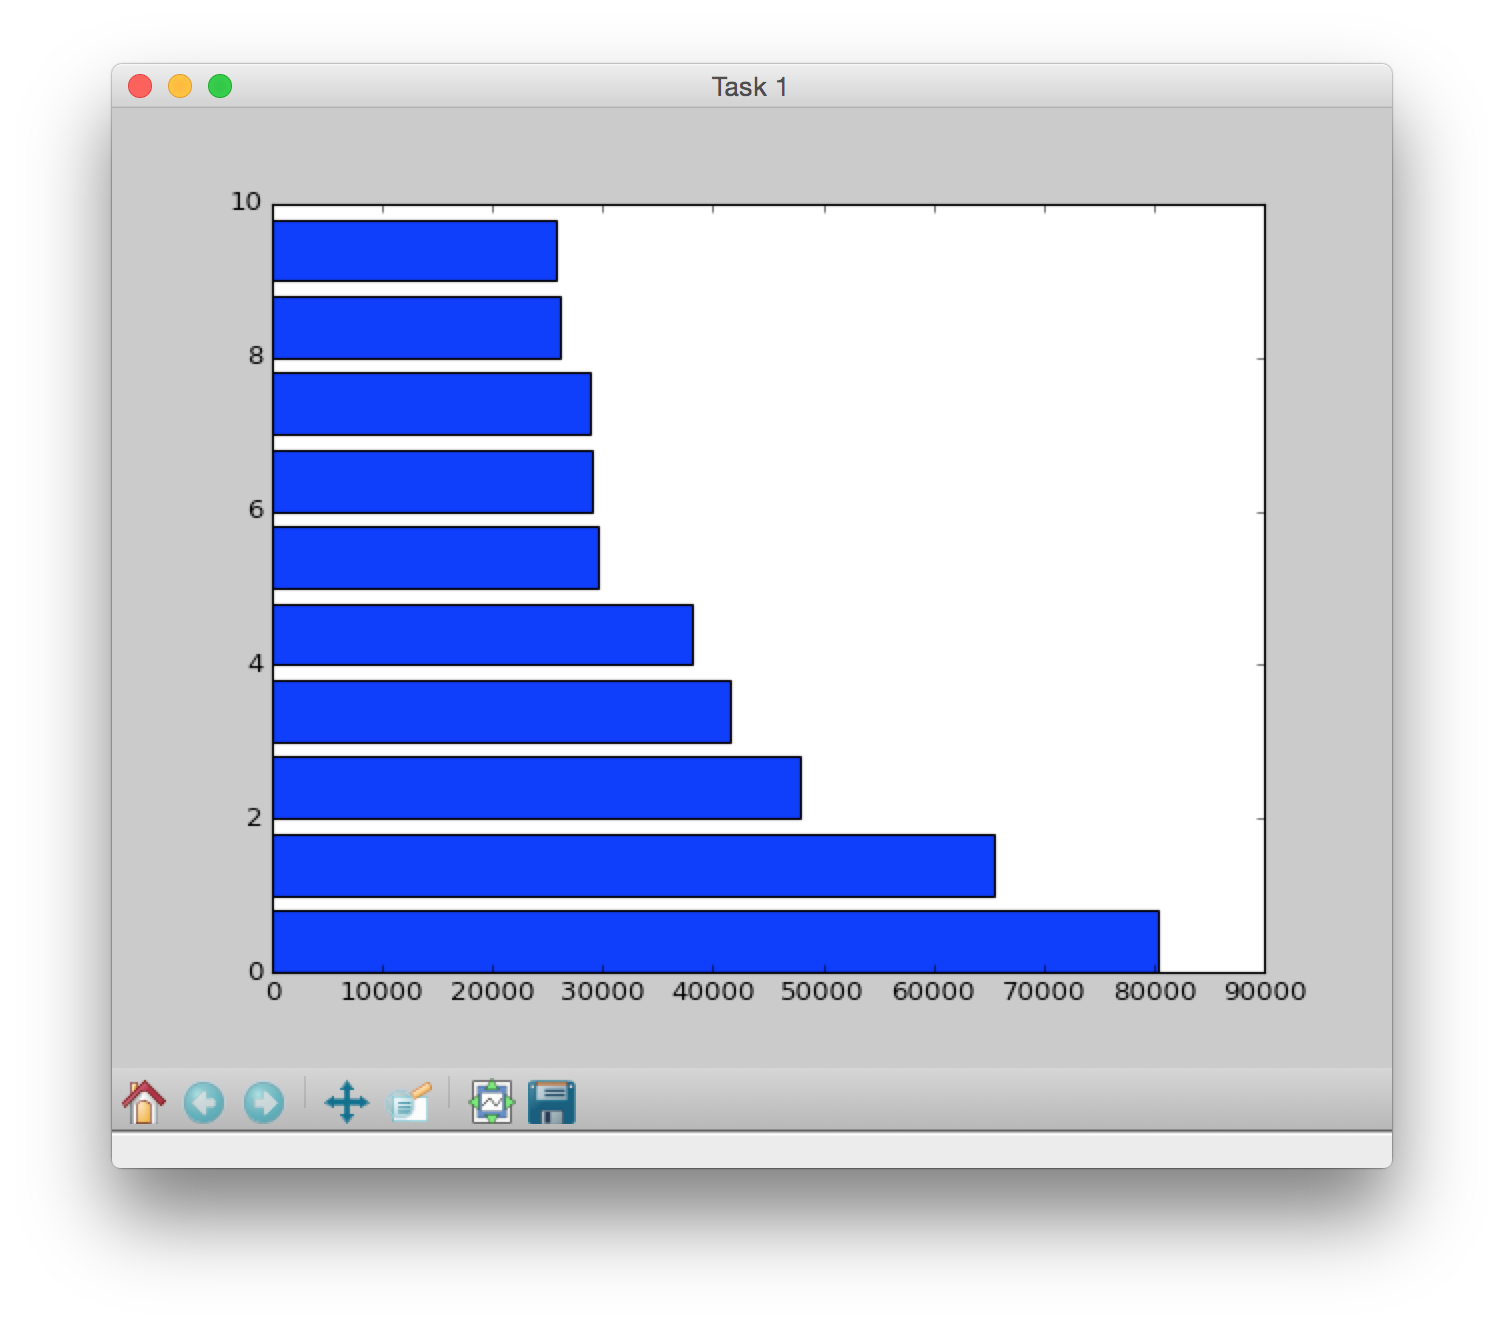
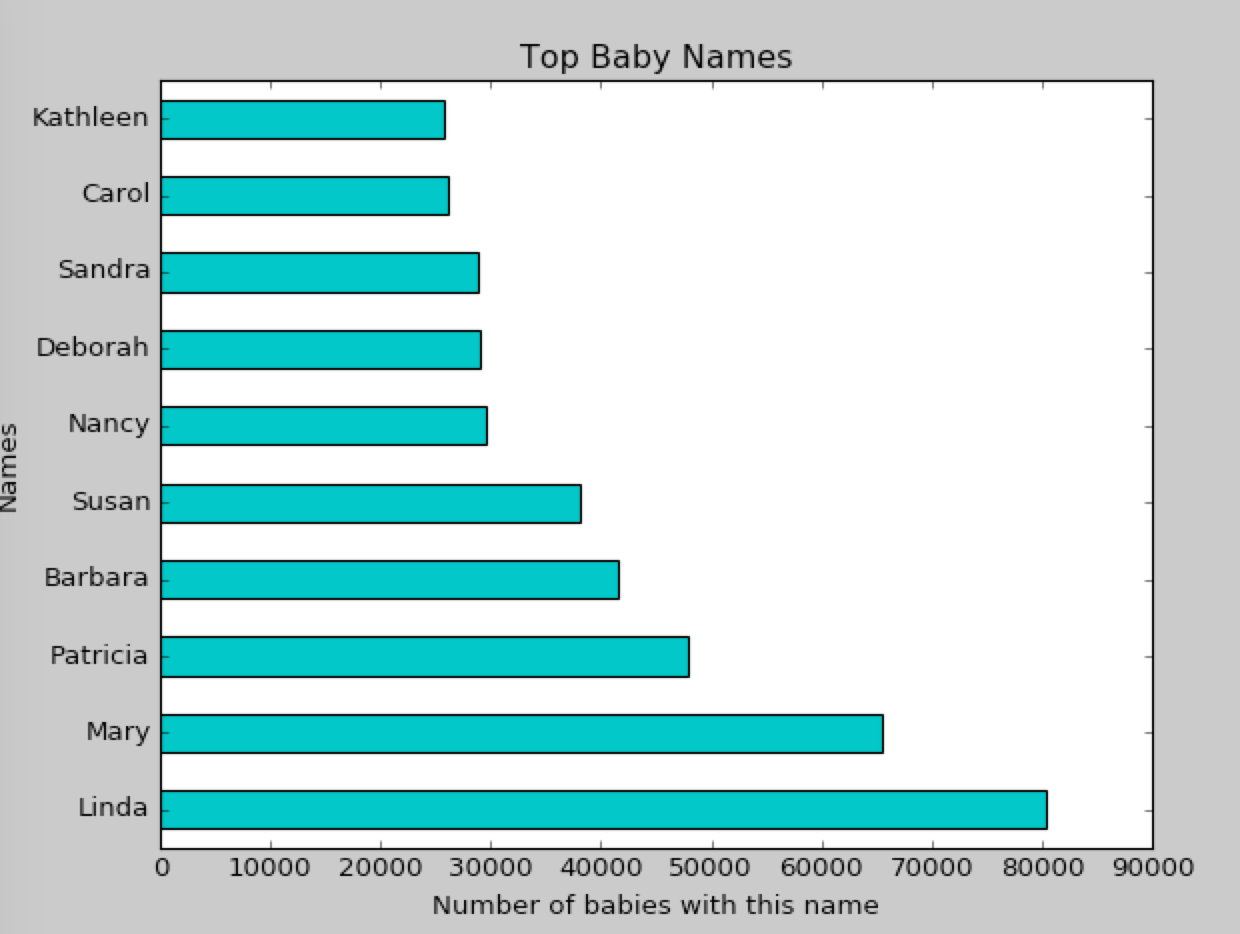
Task 2. Better bar charts
There are several ways in which we can improve the bar graph shown in the task above.
Write a new version of your function (call it makePlot2) by adding these improvements (add them in one at a time):
- Add a title to your plot
- Label the x and y axis
- Change the thickness of the bars
- Change bar color click here for predefined colors in matplotlib
- Add labels to your axis (here is an xtick label example)
Hint: Use list comprehensions to get ytick markers at half increments.
makePlot2(year1950F)
Task 3: Most popular name on top
Write another function called makePlot3 that will plot the names with the most frequently occurring name on top (as shown below).
makePlot3(year1950F)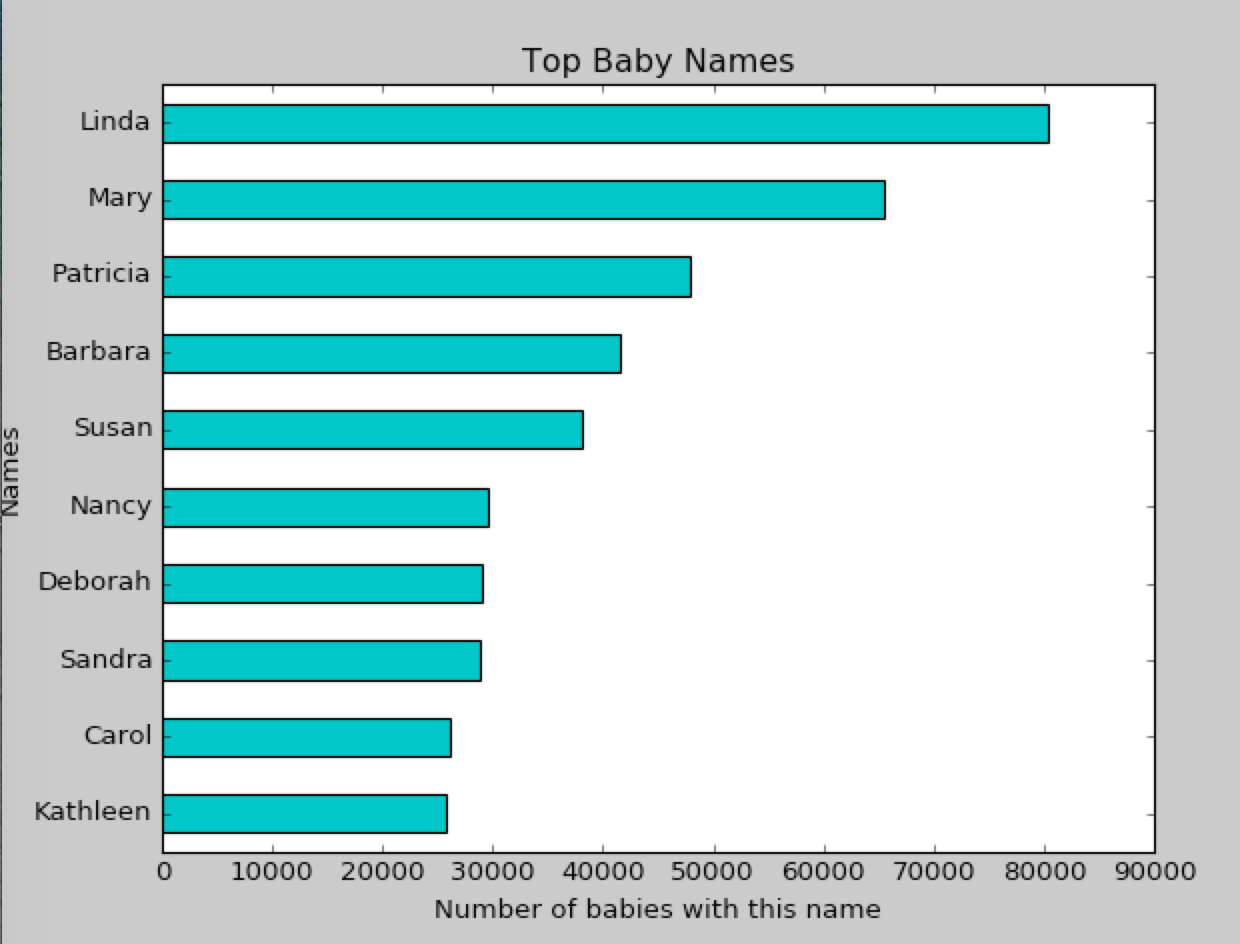
Task 4: Names sorted alphabetically
Plot the names in alphabetical order from top to bottom (as shown below)
makePlot4(year1950F)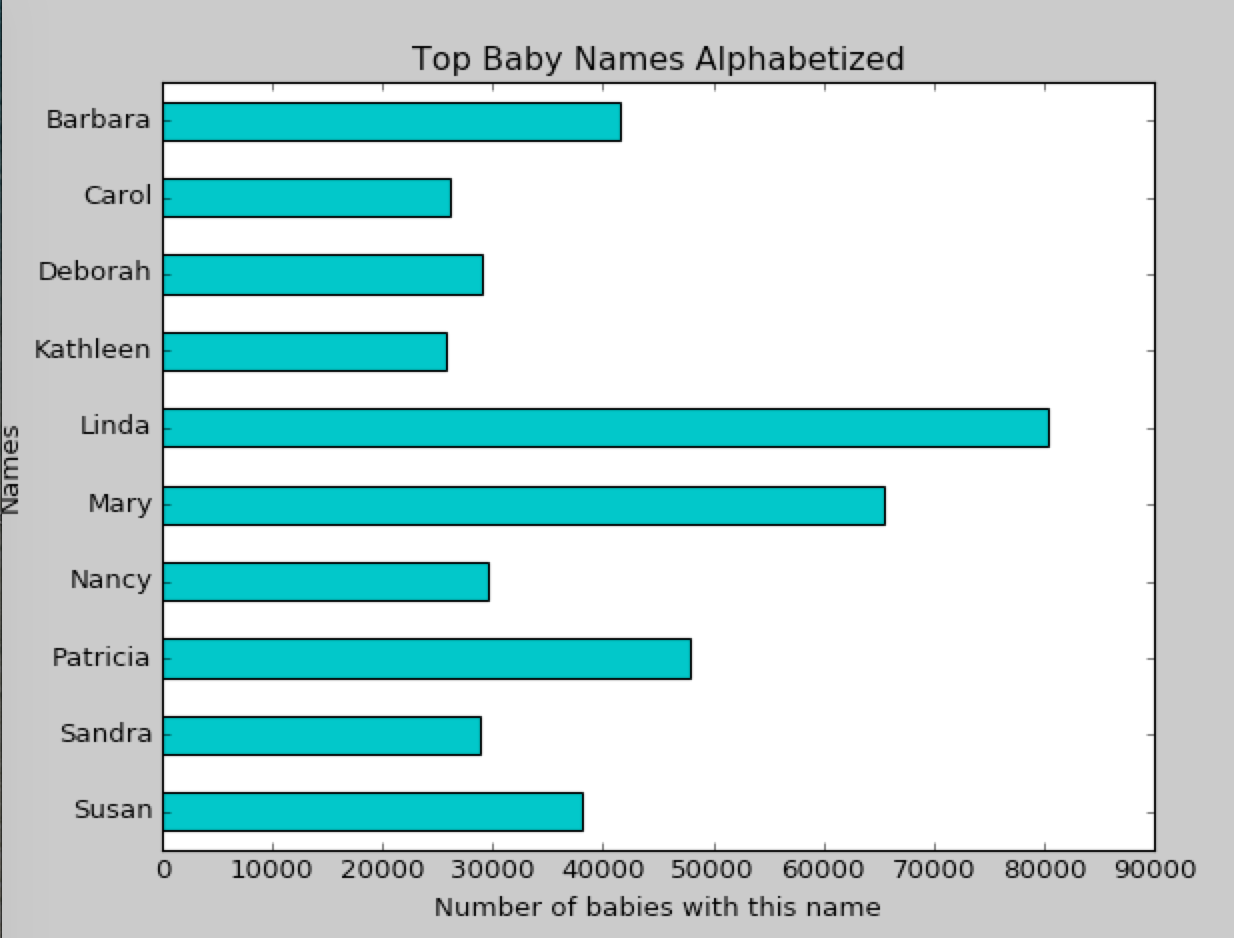
makePlot4(year2000F)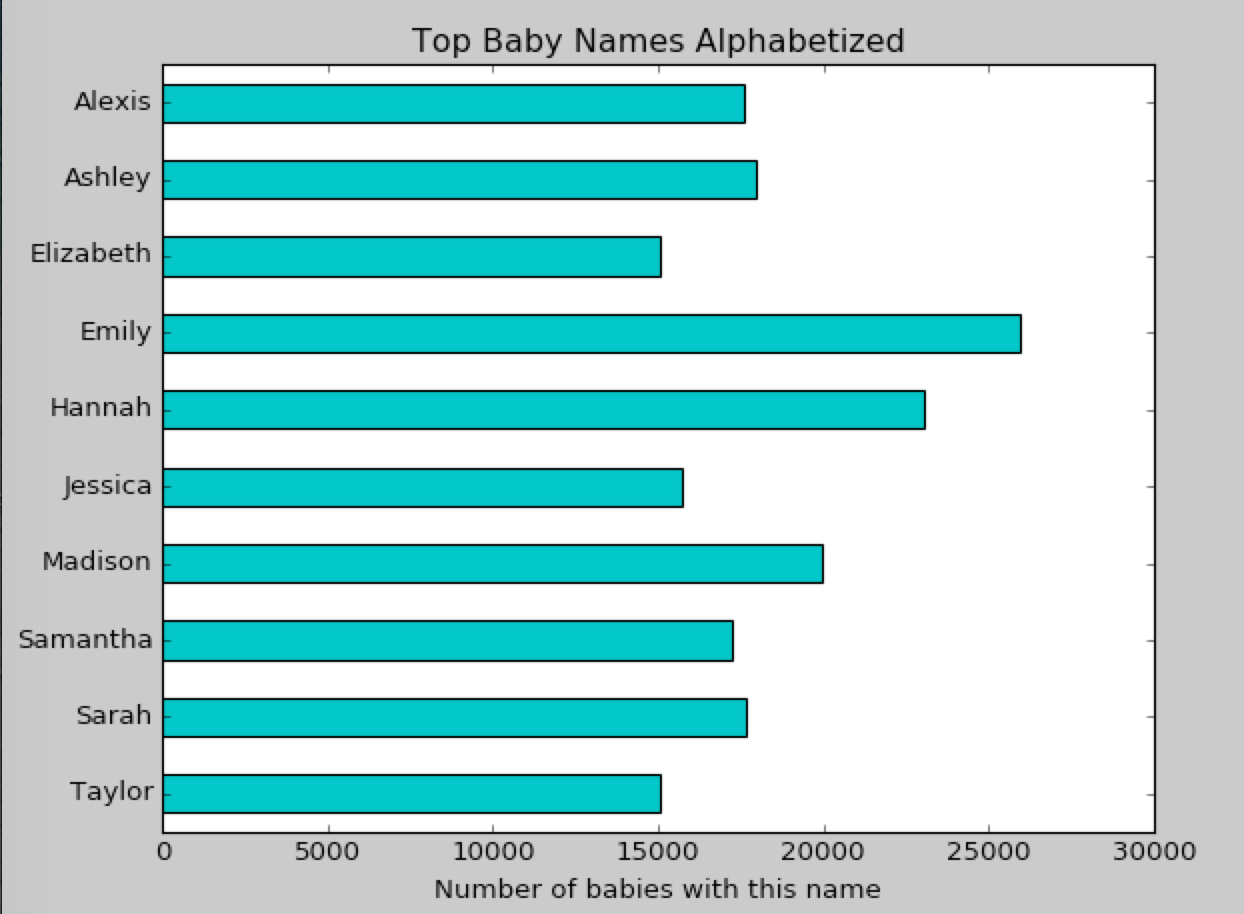
makePlot4(year2000M)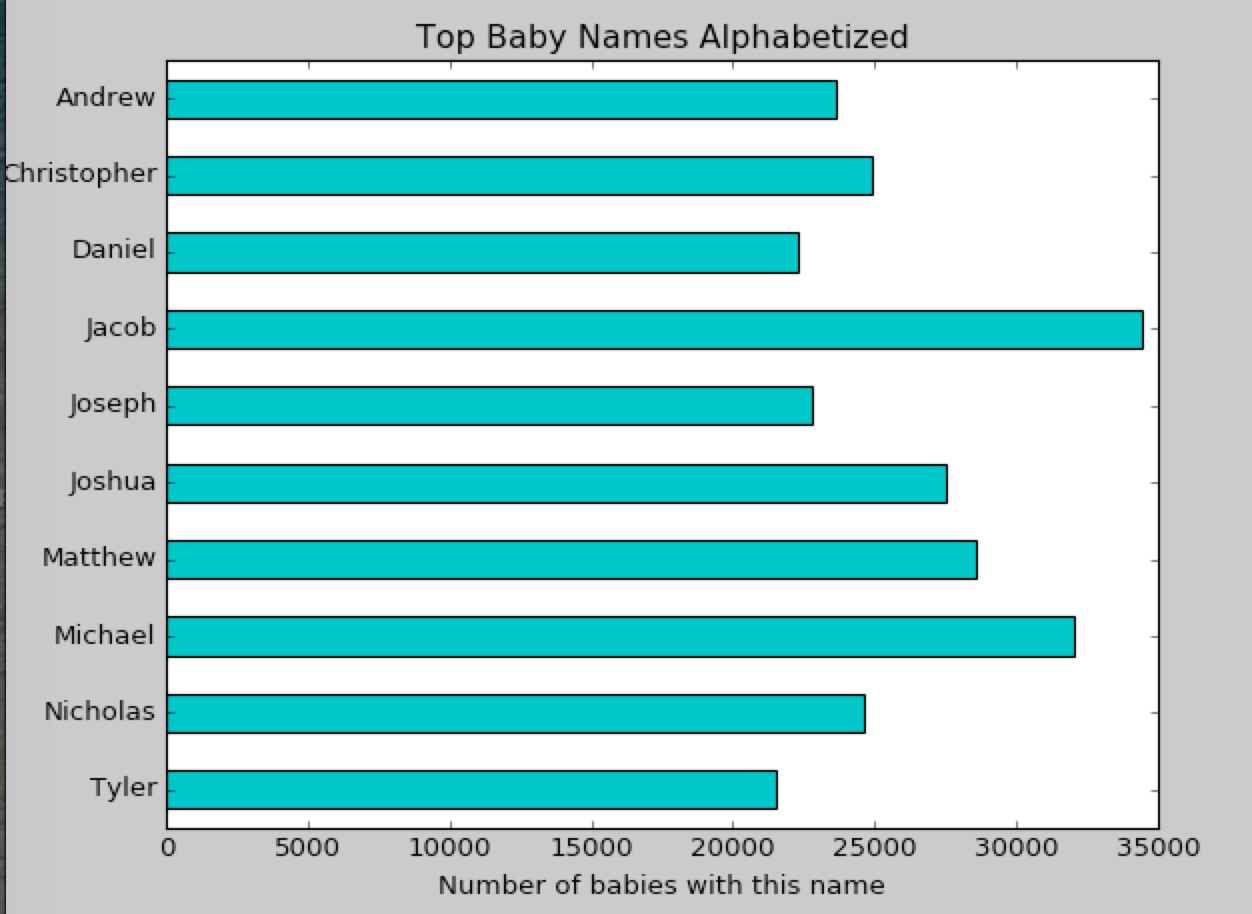
Task 5: Plot last letter percentages of top 10 names
Task 5A: lastLetterNames()
For this task, you'll need to create a new dictionary. Write a new function called lastLetterNames that takes a data variable and returns a dictionary. The keys in the dictionary are the last letters of the names and the values are the names that end with that letter. Here are some examples:
In []: lastLetterNames(year2000F)
Out[]:
{'a': ['Samantha', 'Jessica'],
 'h': ['Hannah', 'Sarah', 'Elizabeth'],
 'n': ['Madison'],
 'r': ['Taylor'],
 's': ['Alexis'],
 'y': ['Emily', 'Ashley']}

In []: lastLetterNames(year1950M)
Out[]:
{'d': ['David', 'Richard'],
 'l': ['Michael'],
 'm': ['William'],
 'n': ['John'],
 's': ['James', 'Thomas', 'Charles'],
 't': ['Robert'],
 'y': ['Gary']}

In []: lastLetterNames(year1980F)
Out[]:
{'a': ['Amanda', 'Jessica', 'Melissa'],
 'e': ['Nicole', 'Michelle'],
 'h': ['Sarah', 'Elizabeth'],
 'r': ['Jennifer', 'Heather'],
 'y': ['Amy']}
Task 5B: plotLastLetterPercents(data)
Now that you have the last letter dictionaries, you can plot the last letters on the Y axis and the percentages on the X axis in a horizontal bar chart.
Write a function called plotLastLetterPercents() that takes in a list of tuples and displays a plot showing the last letters and the percentage representation within the top 10 names.
Note:
- We are plotting percents rather than count
- If you would like to change the background color of the figure,
you can use the
facecolorattribute of figure:plt.figure(facecolor='lightsteelblue')
Example 1:
plotLastLetterPercents(year2000F)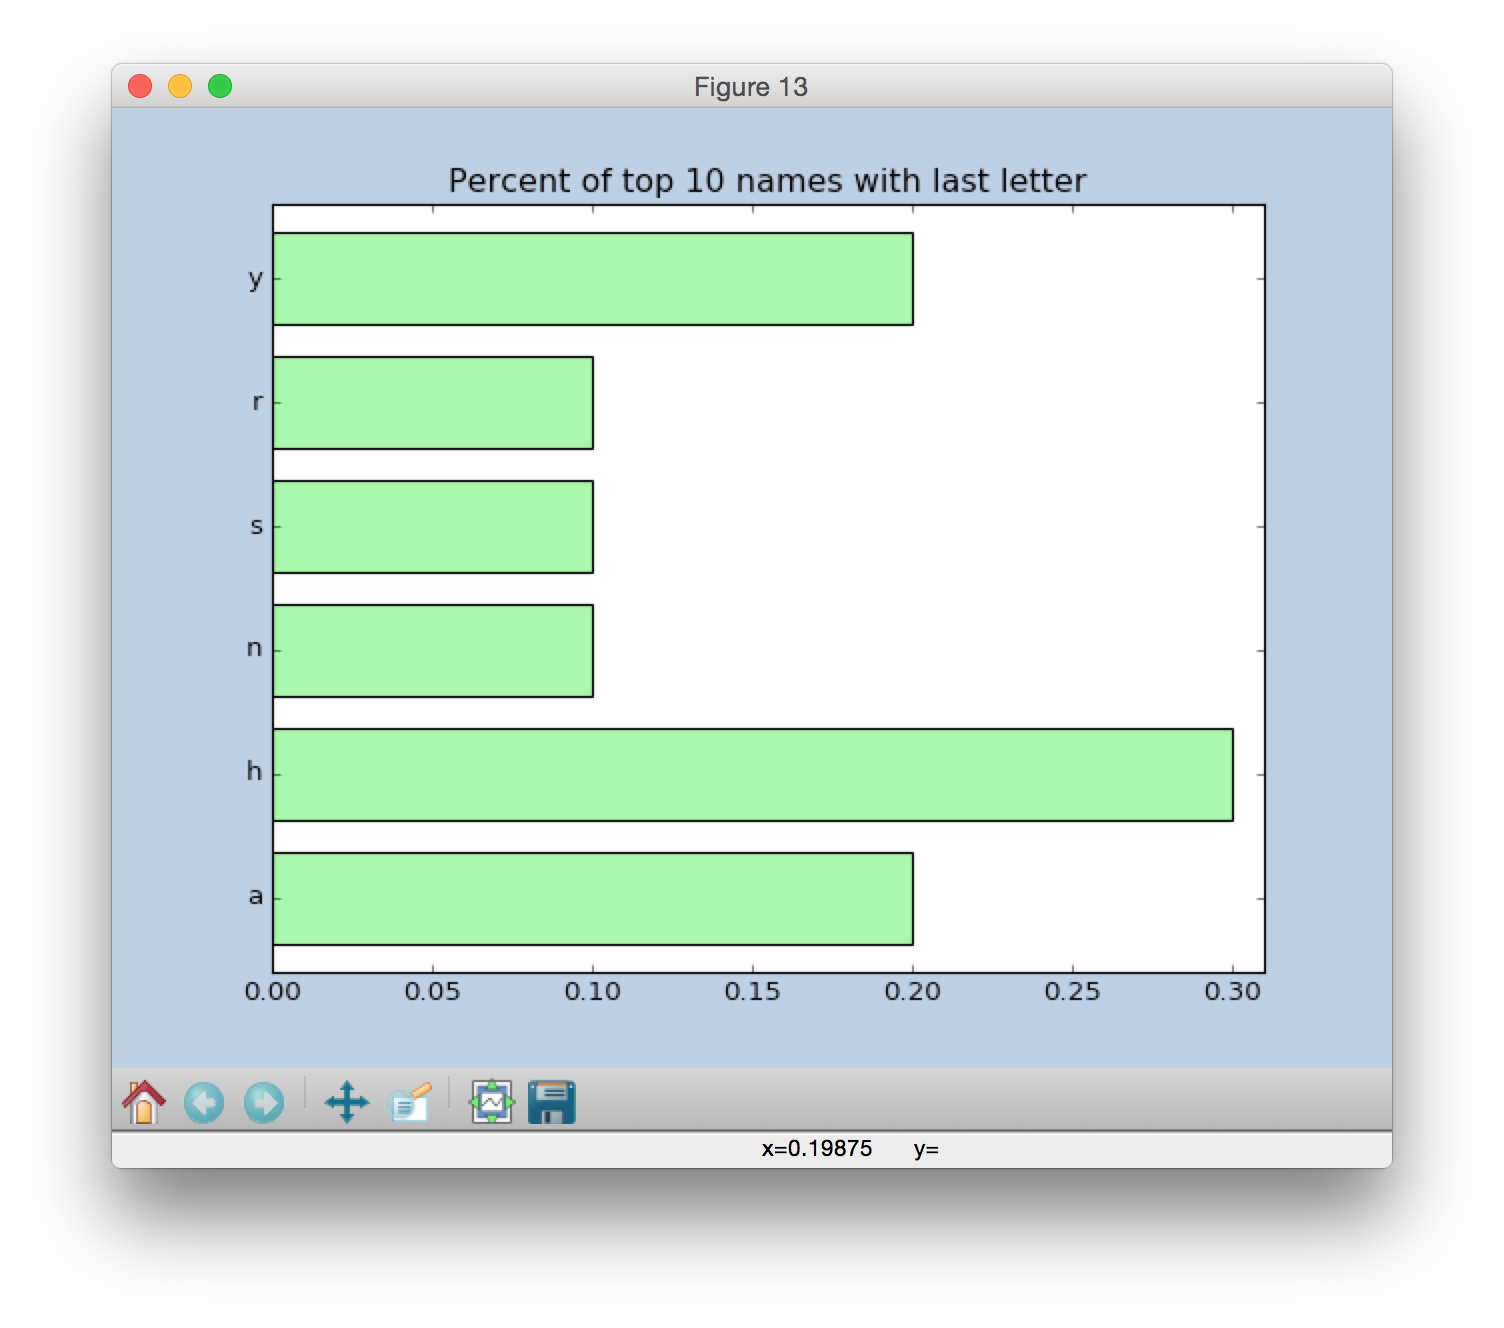
Example 2:
plotLastLetterPercents(year1950M)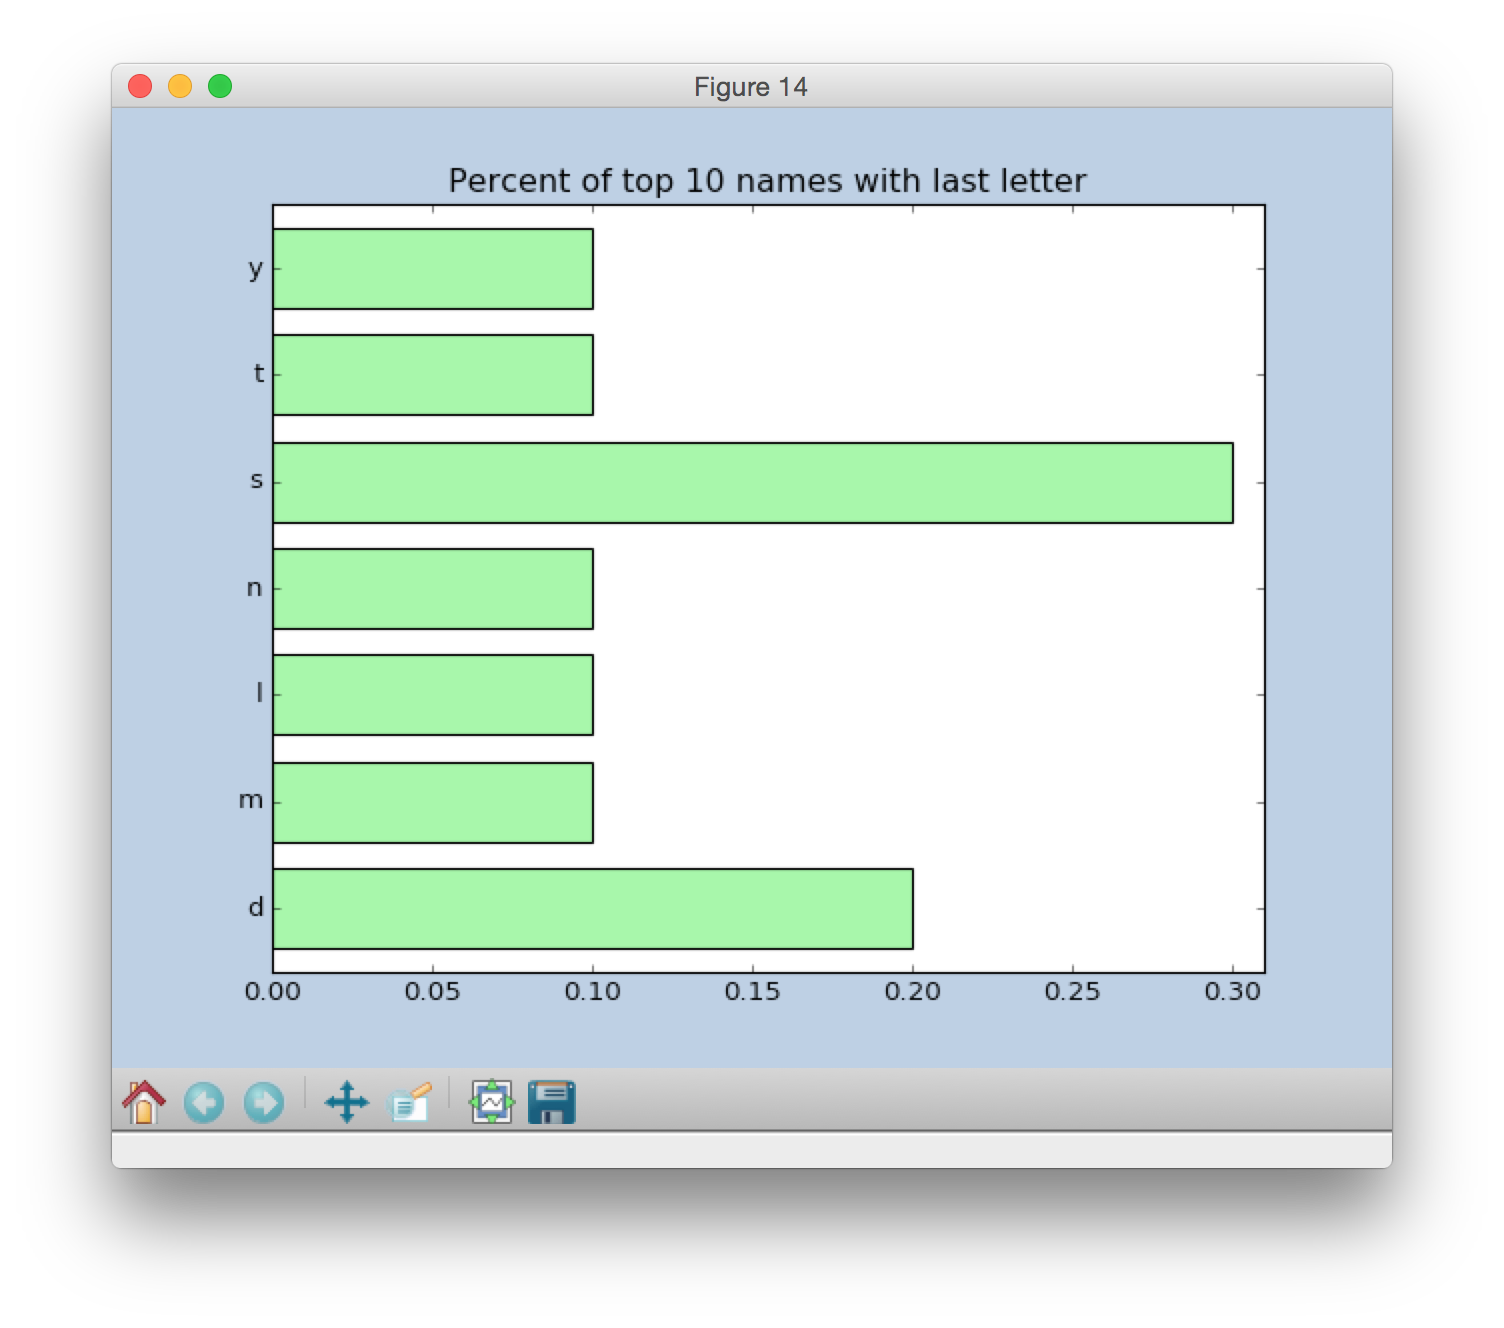
Example 3:
plotLastLetterPercents(year1980F)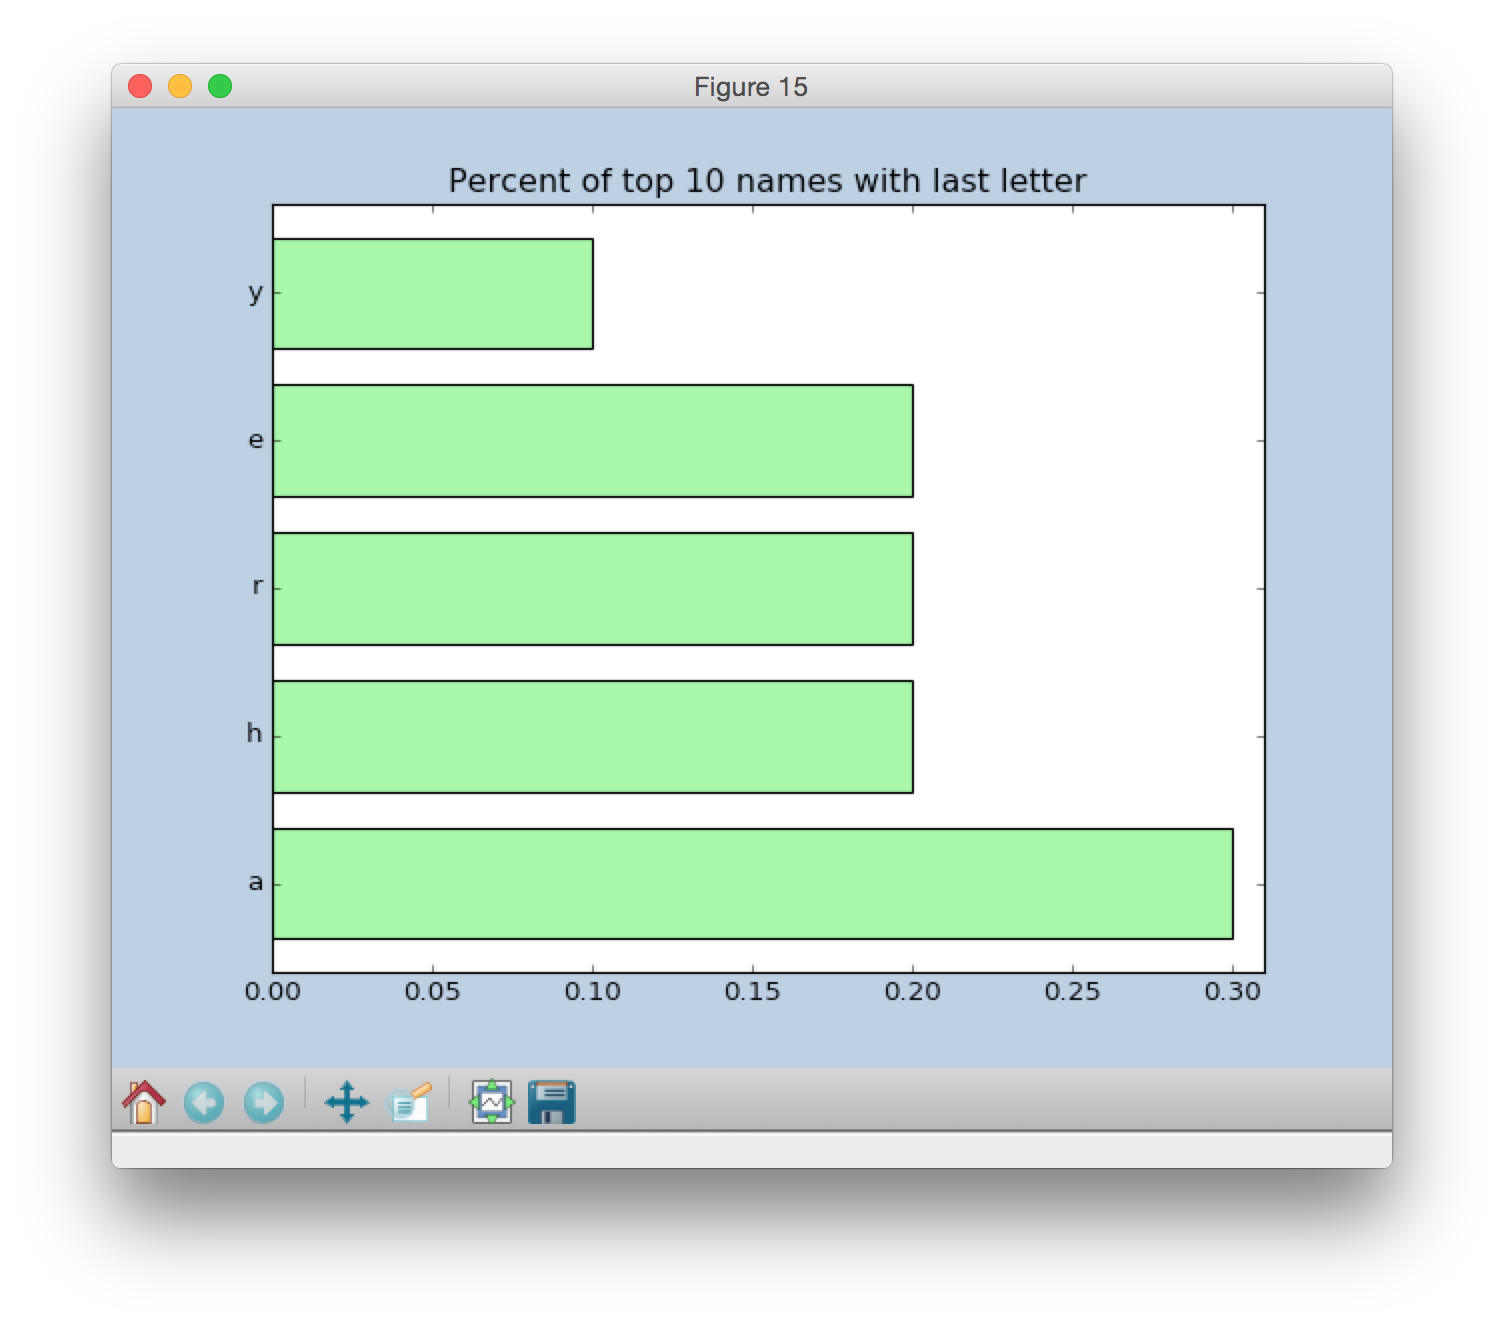
Table of Contents
- How to Plot Home
- Part 1: Intro to plotting
- Part 2: Baby name bar plots
- Part 3: Candy Power Rankings
- Part 4: Baby name pie charts
- Reference: matplotlib colors
- Reference: Simple bar chart examples
- Reference: How to make a pie chart
- Reference: Plotting examples