Part 3: Plotting Candy Power Rankings
Task 1: Plot the Ultimate Halloween Candy Power Rankings
The website fivethirtyeight.com has an Ultimate Halloween Candy Power Ranking. The ranking comes from asking users to choose their preferred candy froma selection of two. Data was collected from about 269,000 matchups and from 8,371 different IP addresses.
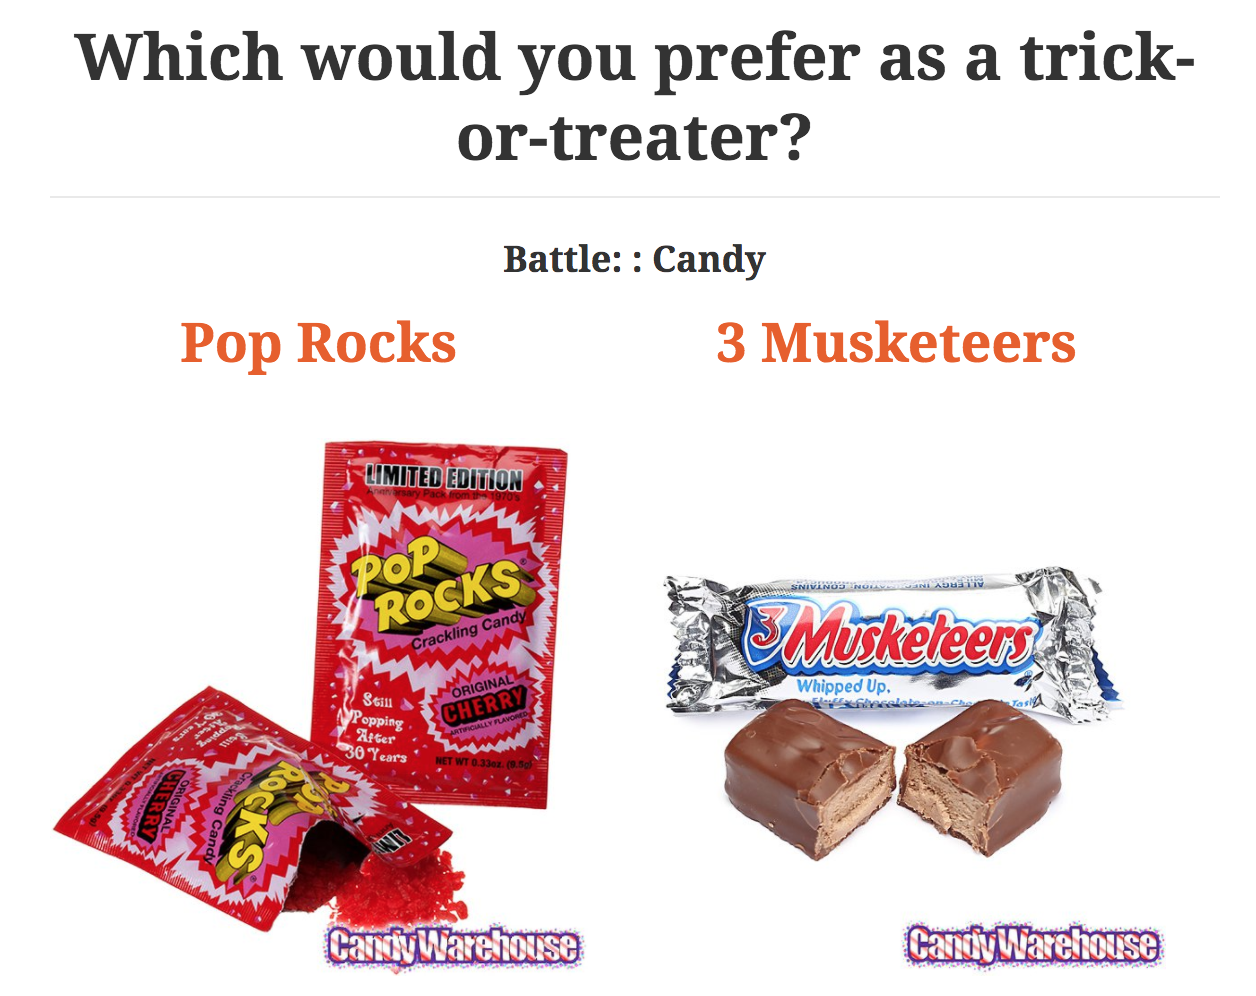
We will be using this data, which is stored in a variable called candy in candyData.py in your plotting folder. Import this file so you can access the candy variable.
Task 1a: View the data in candyData.py so you understand the structure.
Task 1b: Write makeCandyPlot()
Your makeCandyPlot function takes 2 parameters: data and how many of the top ranked candies to plot. Note that all 3 of the examples below are plotted
from the same function. The user specifies how many of the top candies
are to be plotted. The plots show the most selected
candy (Reese's) at top. The makeCandyPlot function also saves each
plot in a filename that as indicated in the examples below.
Example 1i
makeCandyPlot(candy,7)
# saves the plot in a file called `candyTop7.png`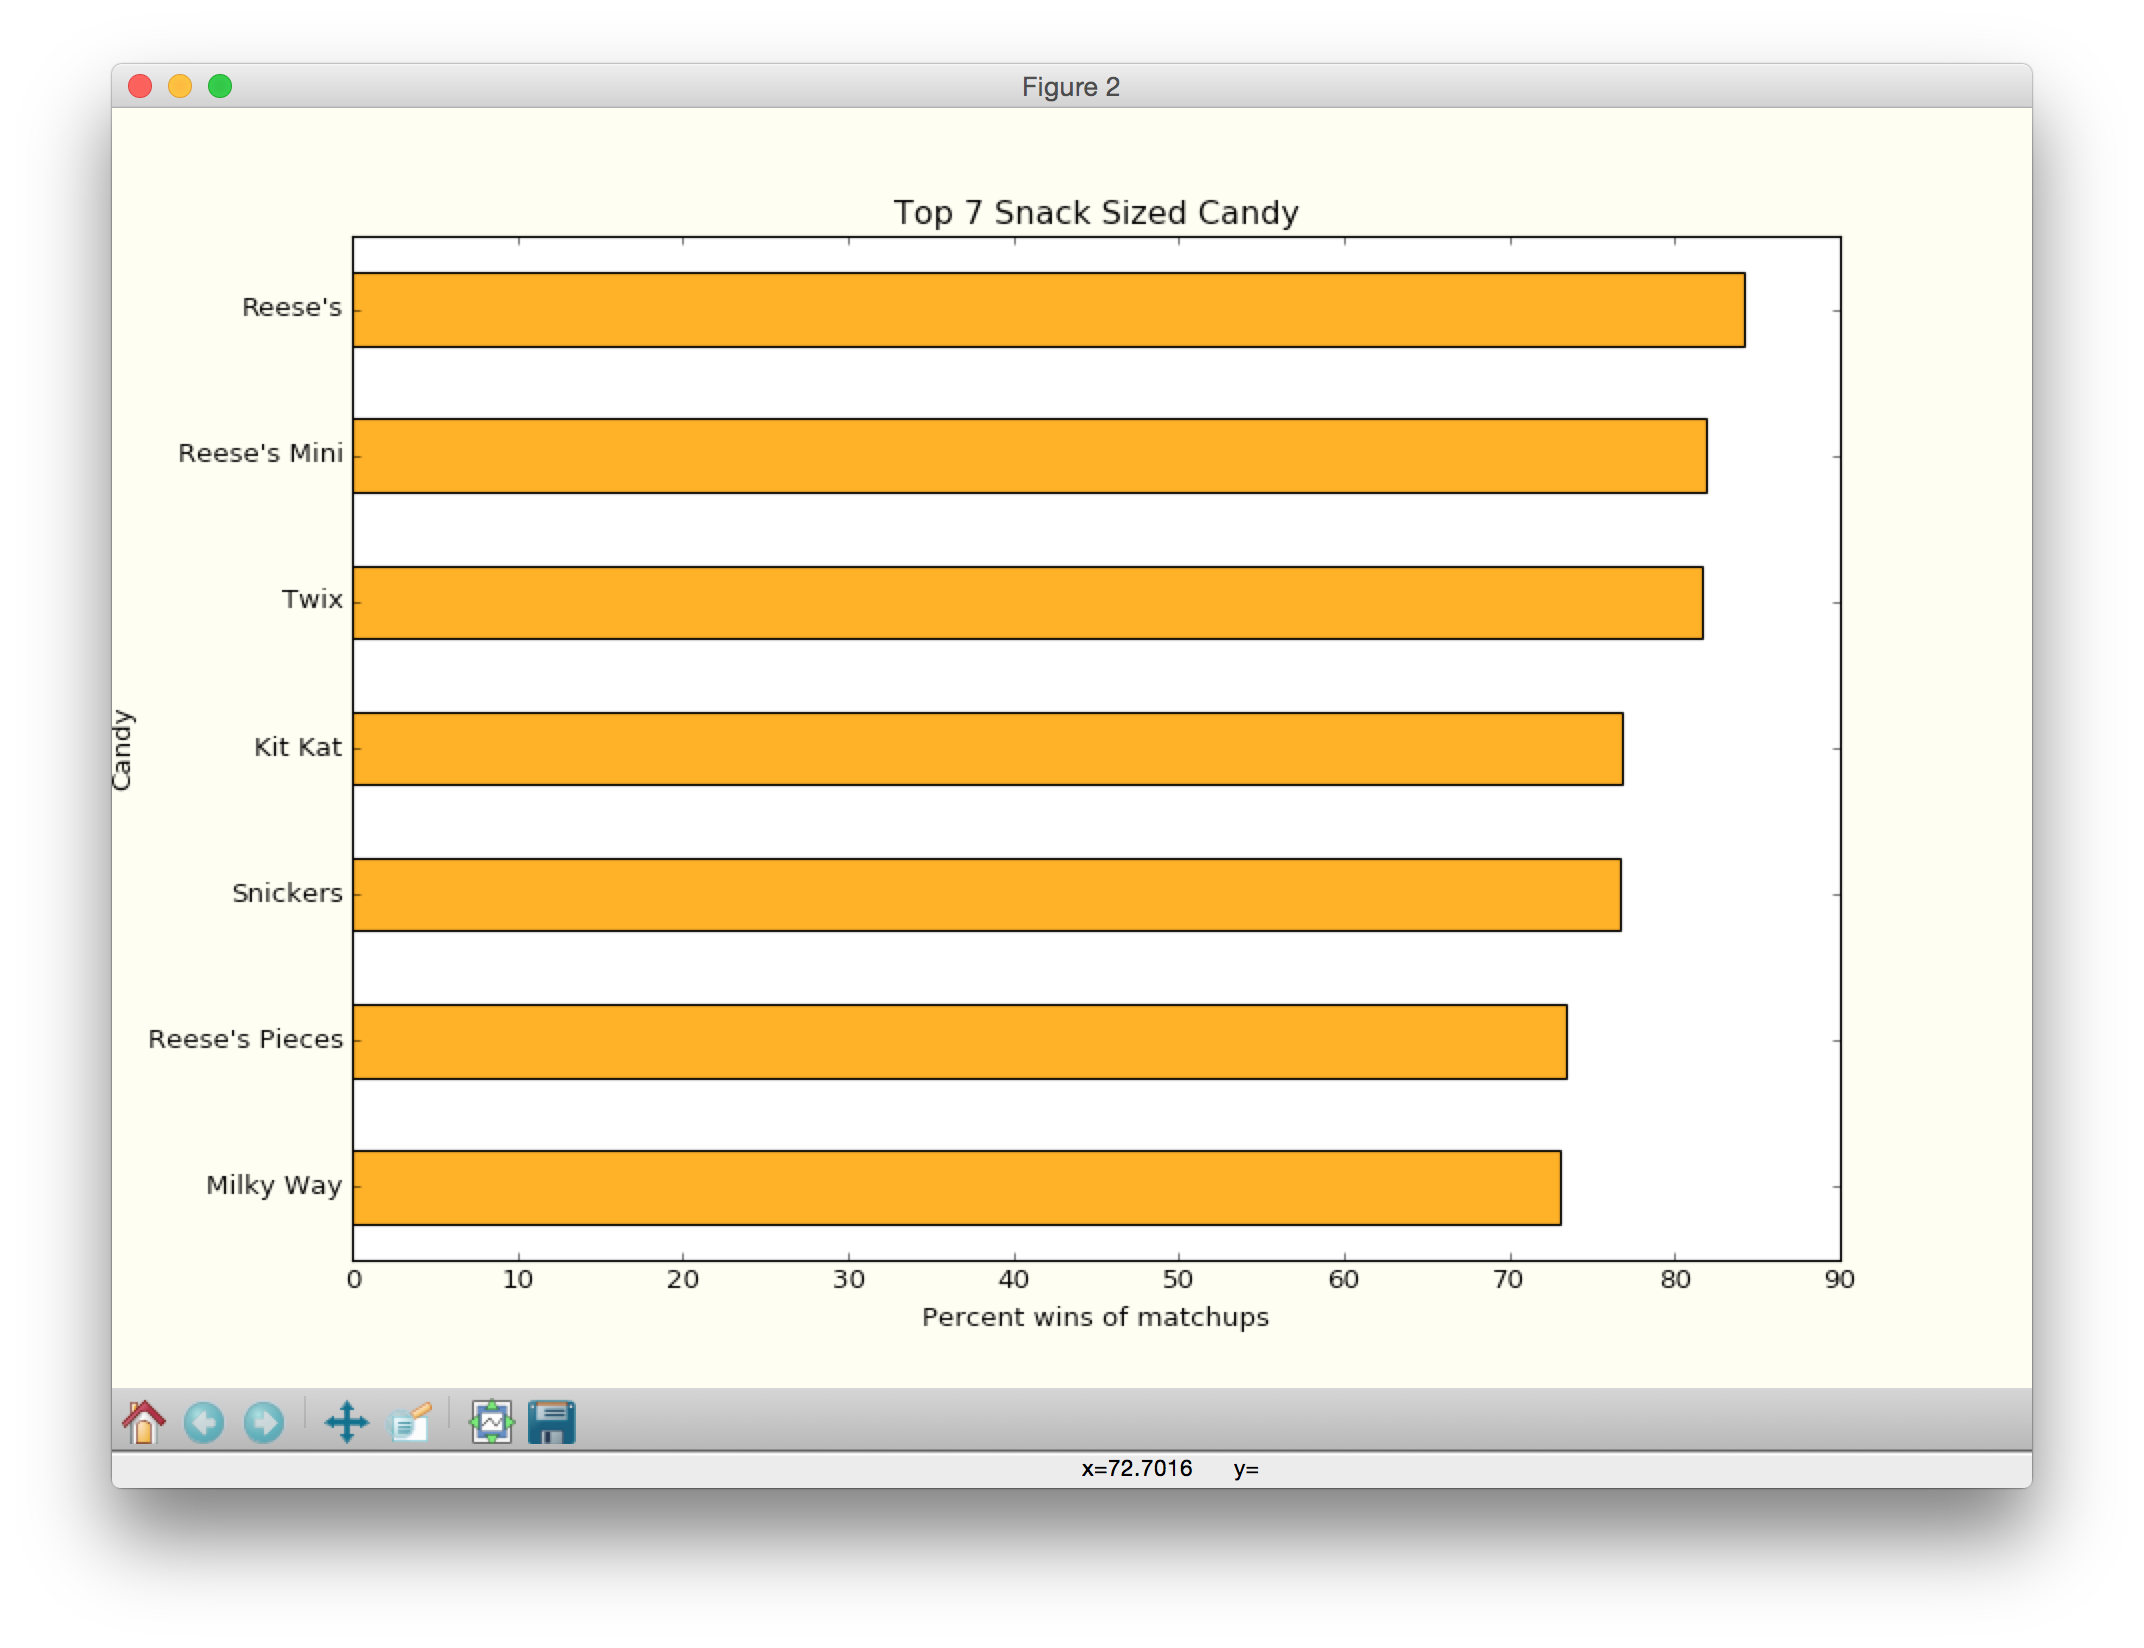
Example 1ii
makeCandyPlot(candy,20)
# saves the plot in a file called `candyTop20.png`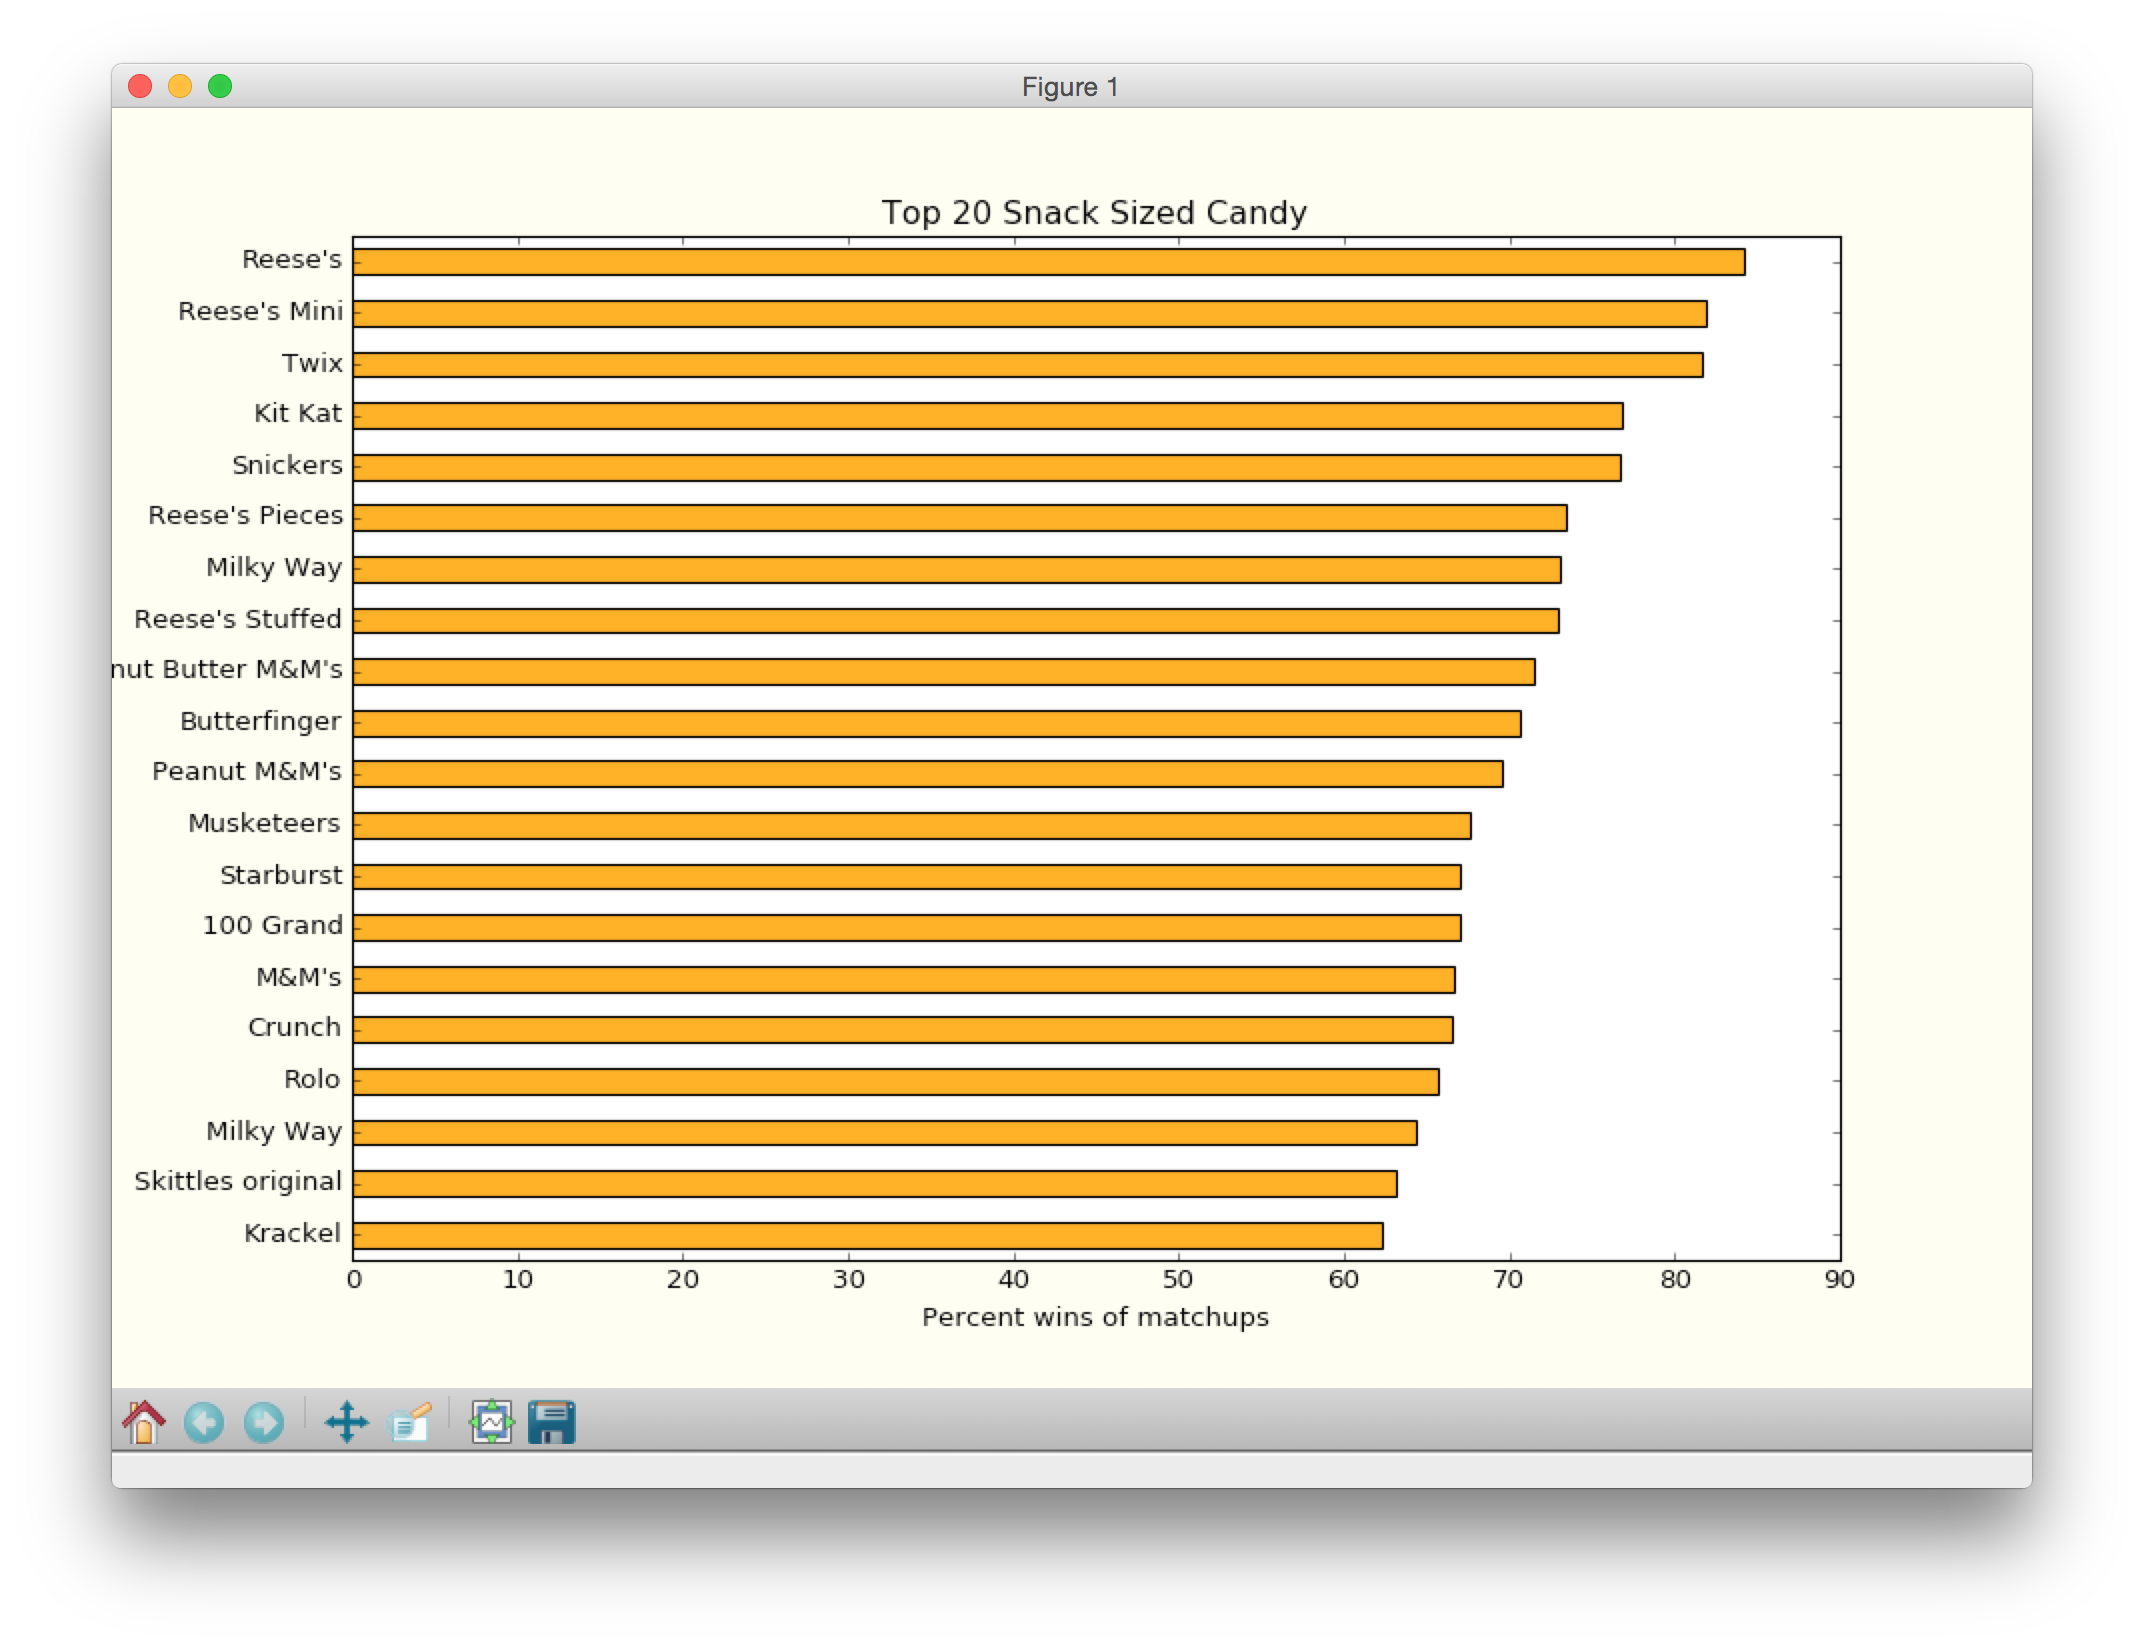
Example 1iii
makeCandyPlot(candy,50)
# saves the plot in a file called `candyTop50.png`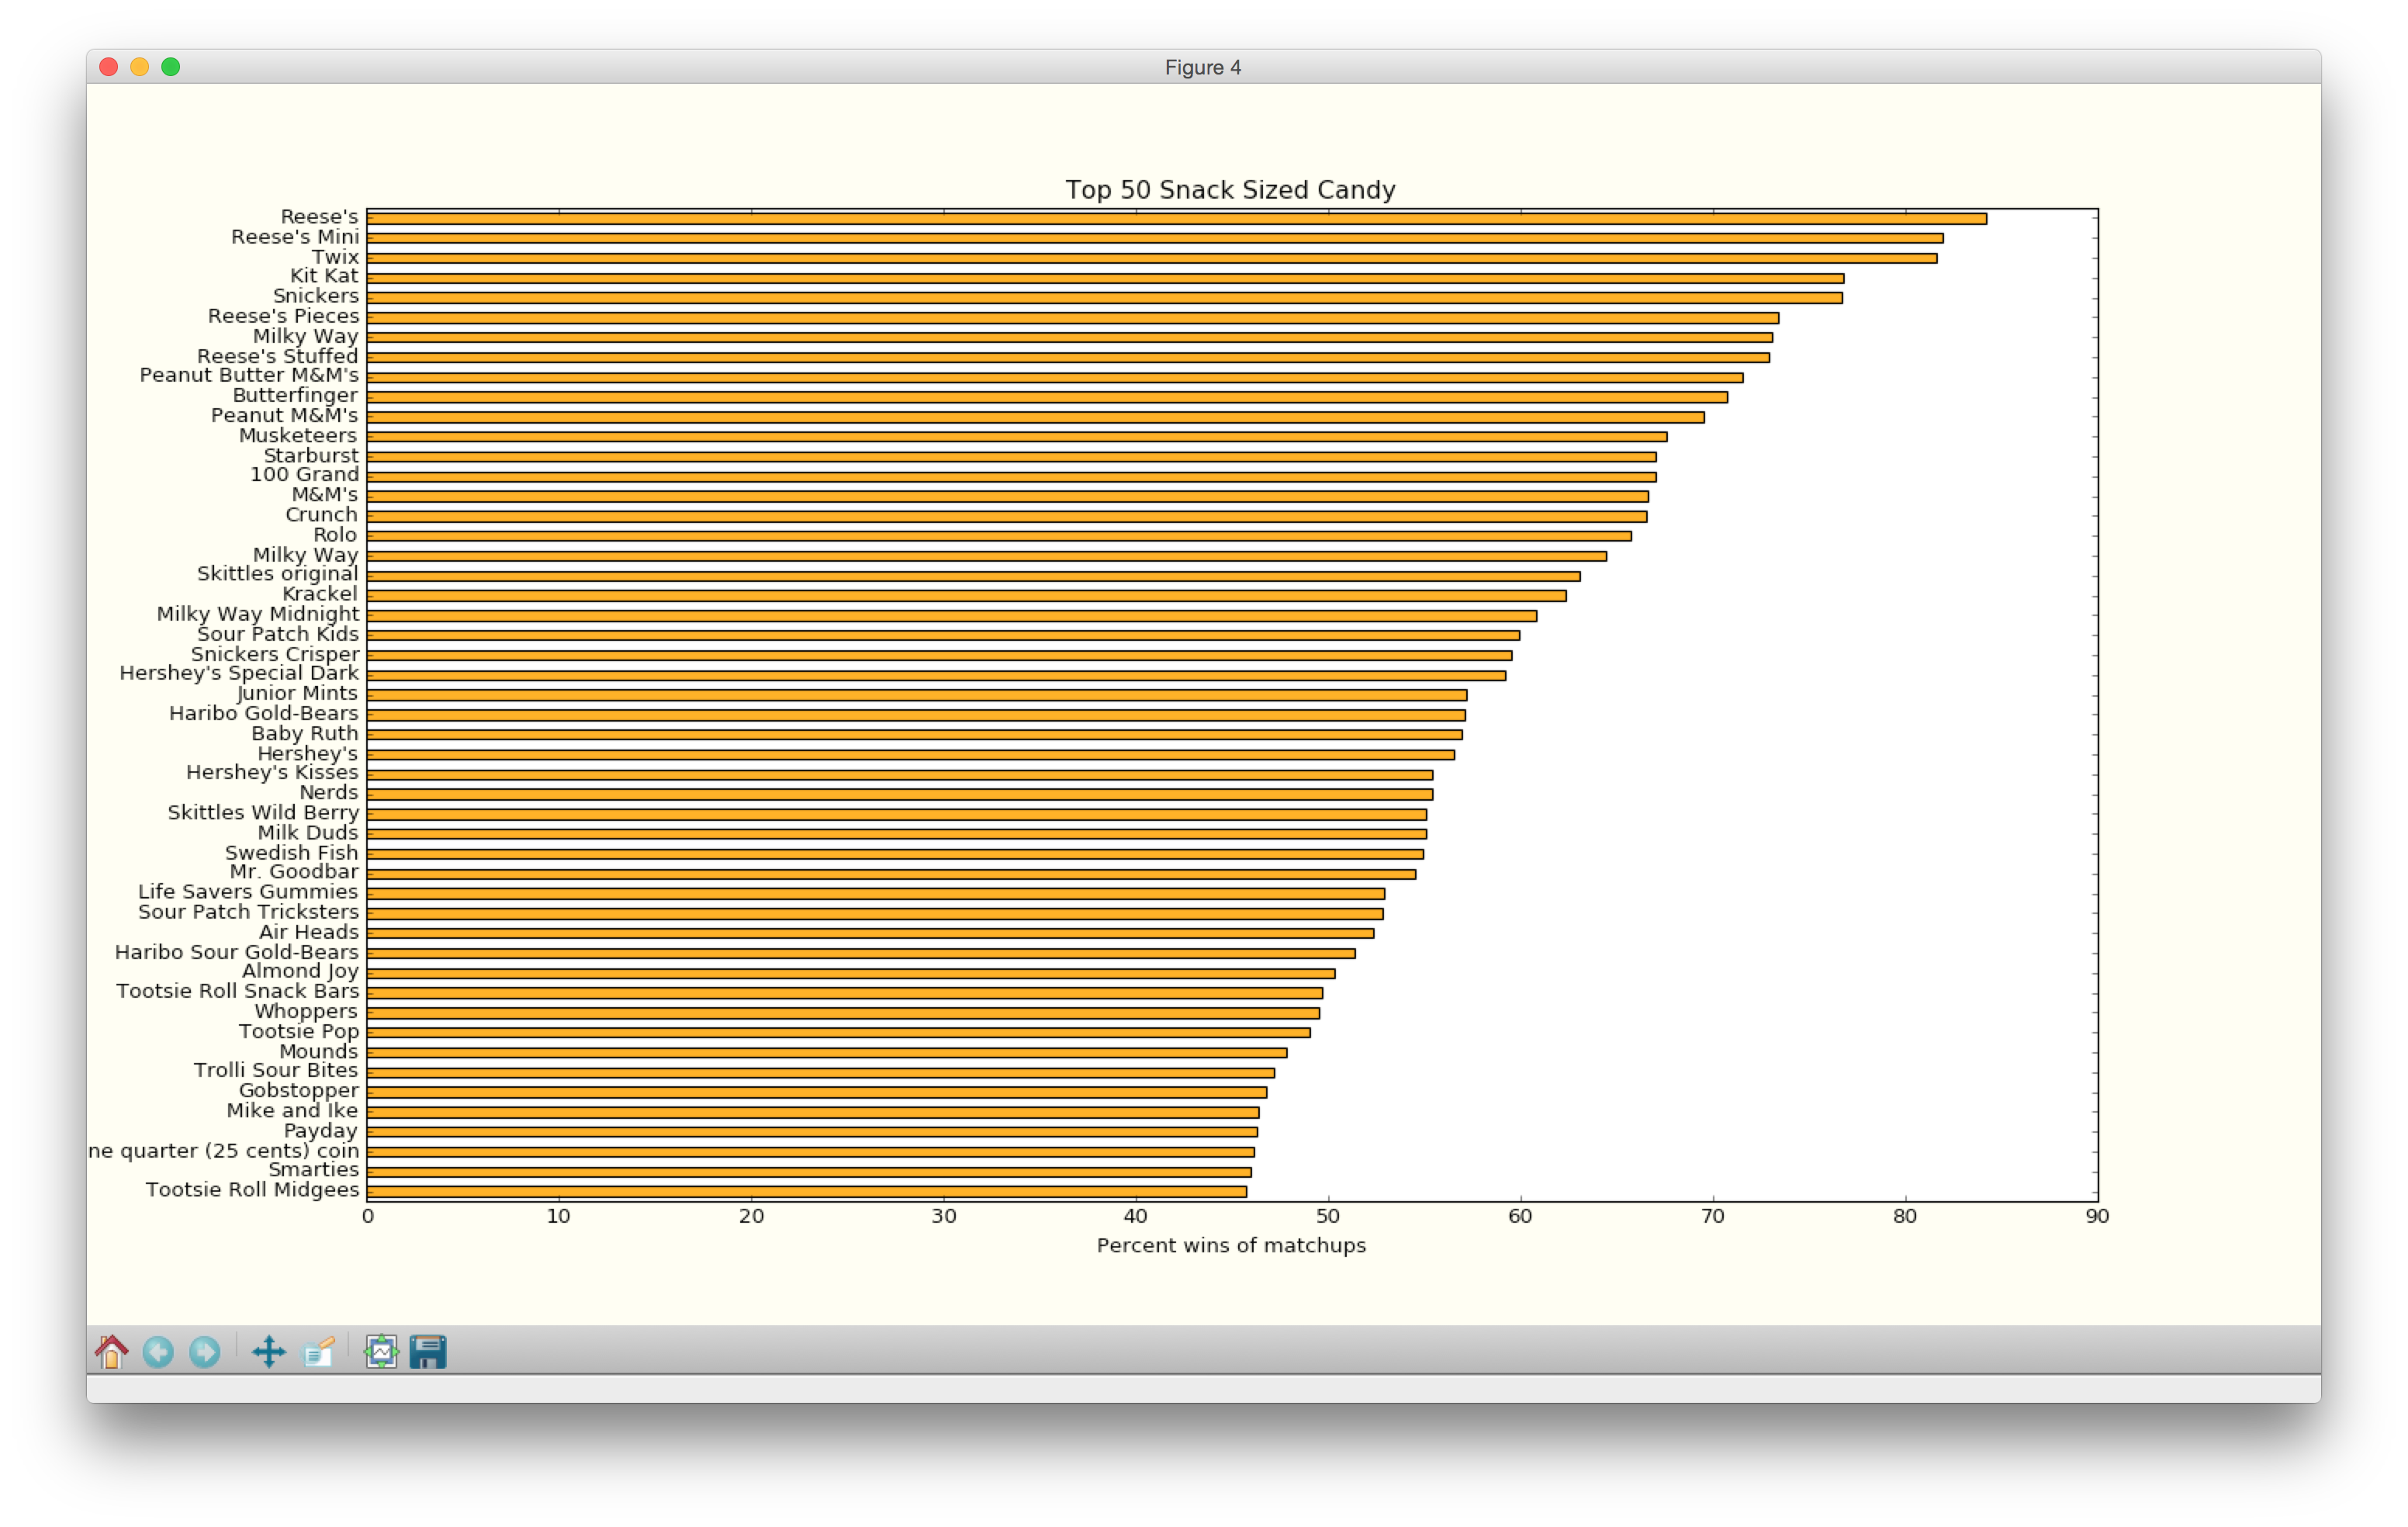
Task 1c: Check your lab09 folder for the newly generated plots
If your working directory is set to be your lab09 folder, then look inside that folder and check that plots are correctly saved.
Task 2: Plot the Ultimate Halloween Candy Power Rankings over a given percentage
In this task, instead of pulling a specific number of data entries, we will select our data set based on the percentage of wins that the user specifies. For example, if the user selects 75%, then we will plot all candy that has a percentage greater than 75%.
Task 2a: makeCandyPlotByPercentage
This function takes two parameters: the data and the winning percentage cutoff. It plots all the candy that has a winning percentage higher than the given cutoff.
Example 2i
makeCandyPlotByPercentage(candy,80)
# saves the plot in a file called `candyTopPercentGreaterThan80.png`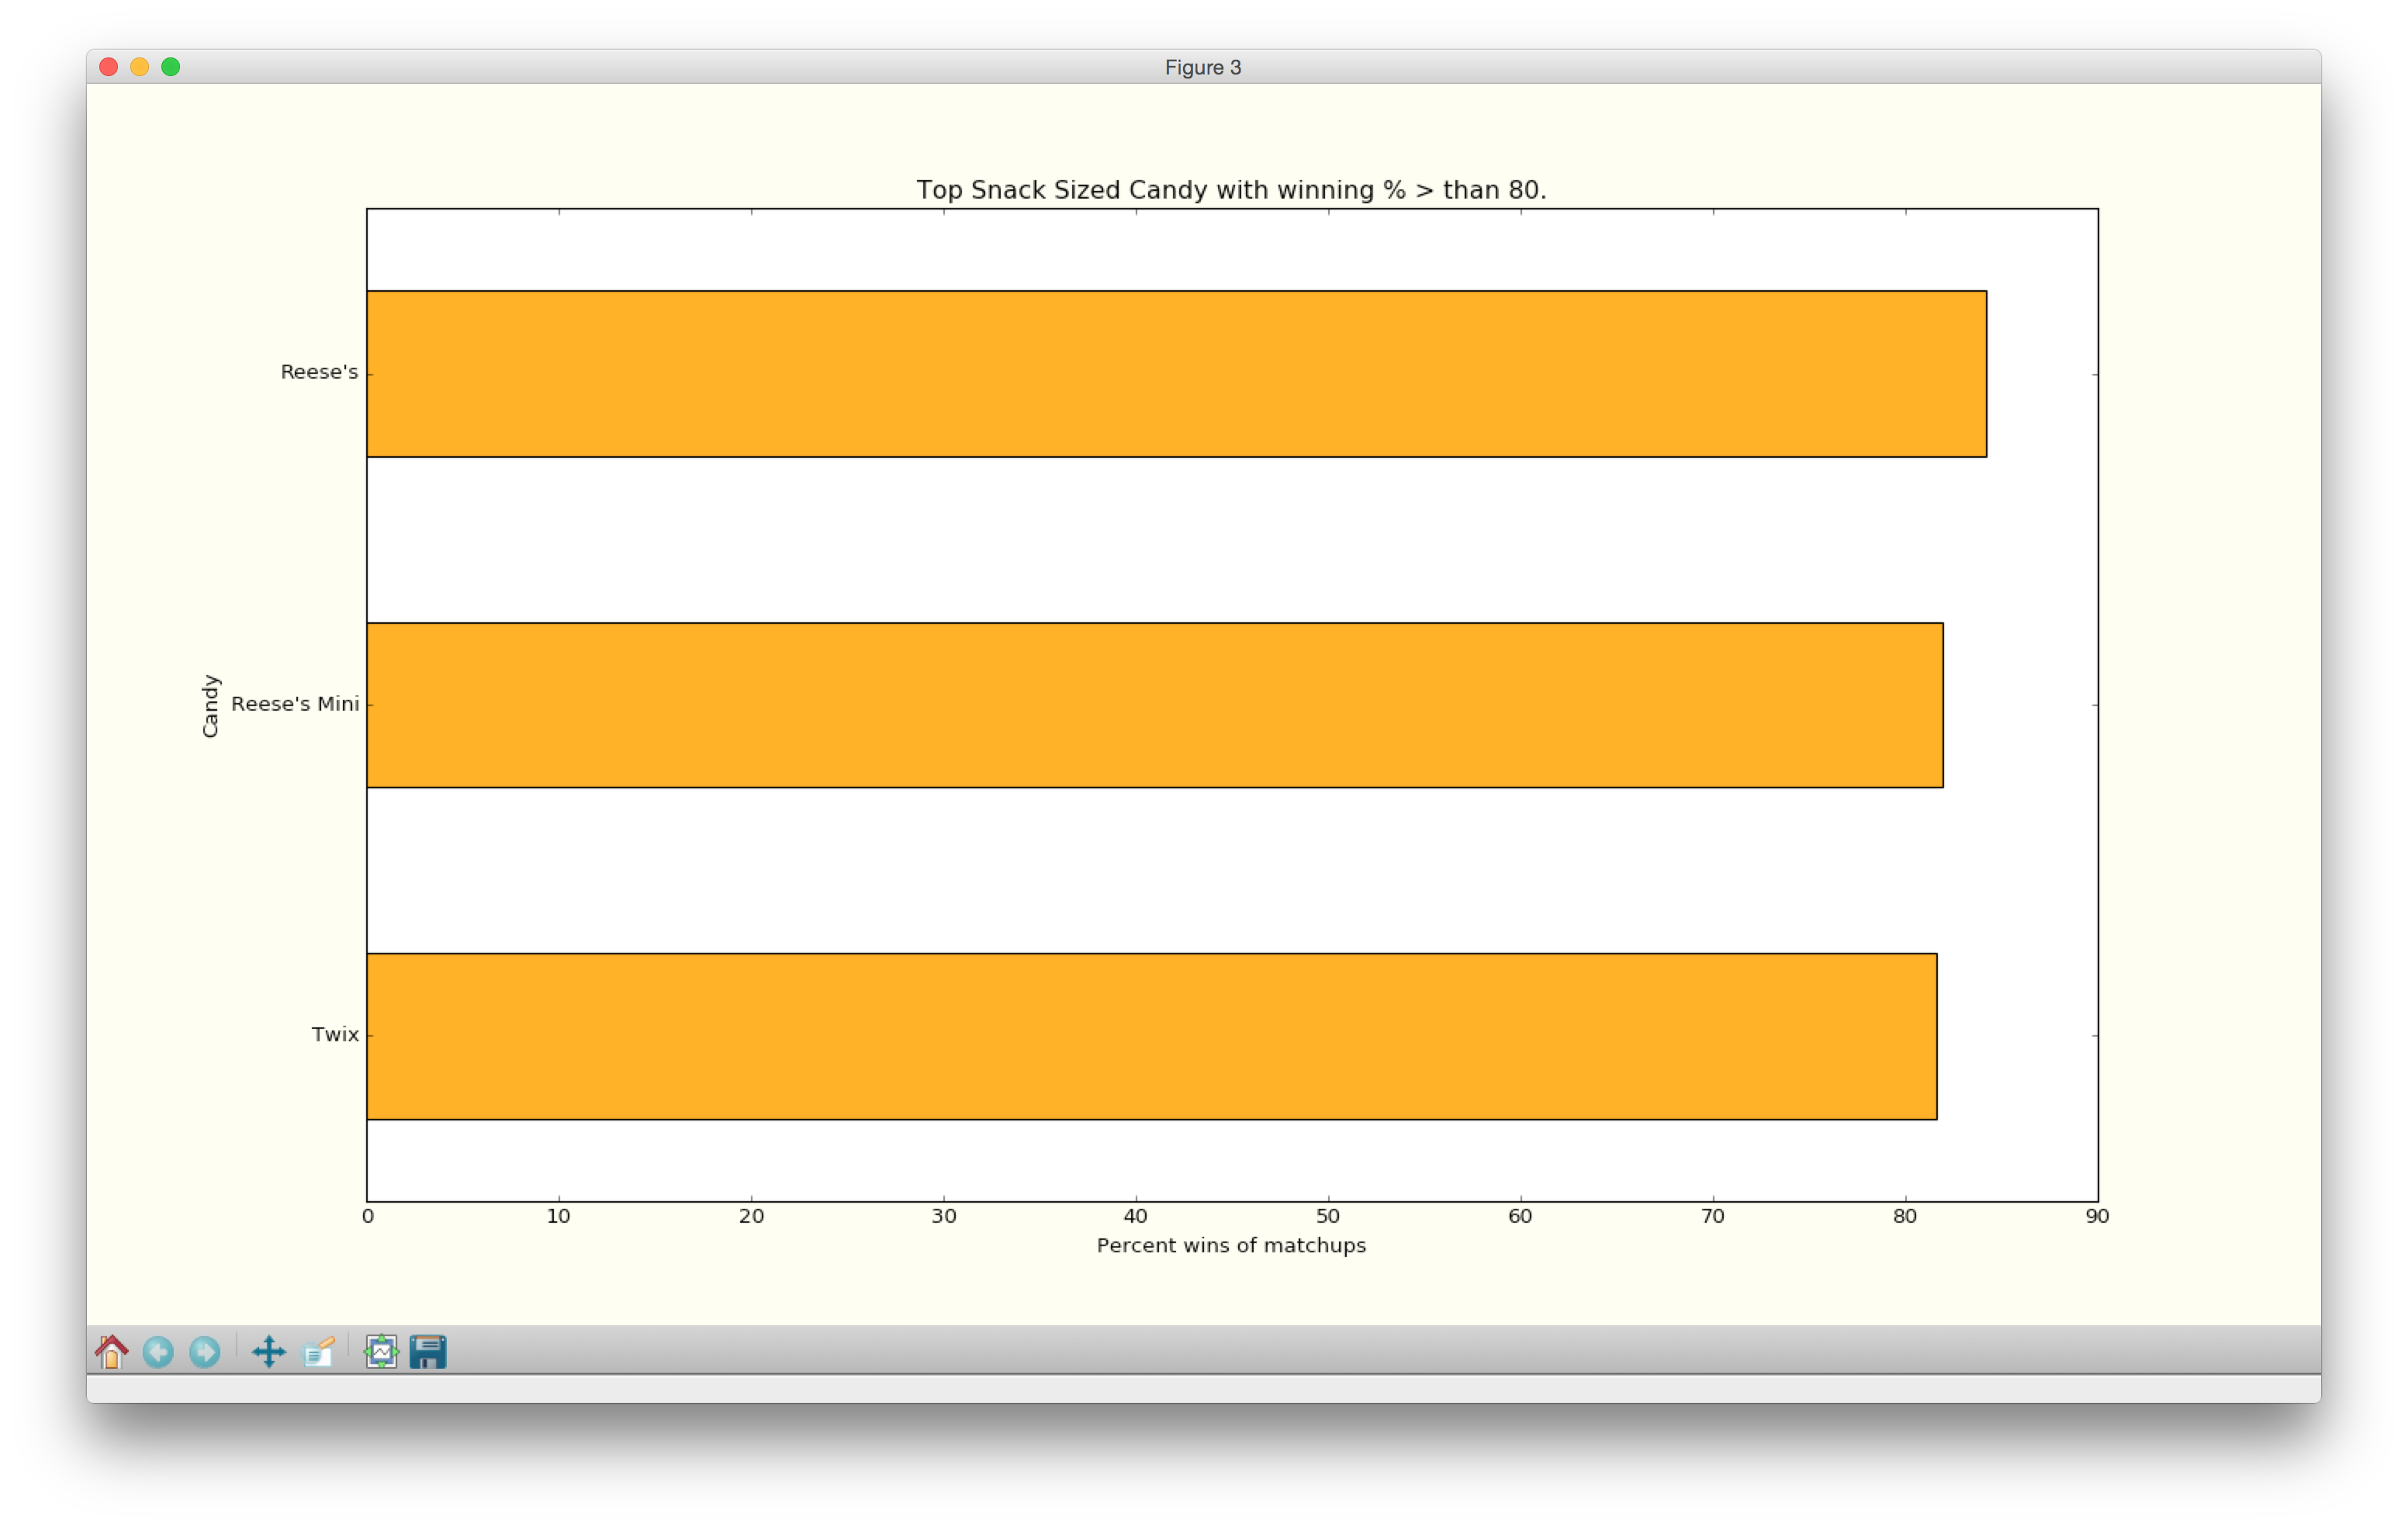
Example 2ii
makeCandyPlotByPercentage(candy,70)
# saves the plot in a file called `candyTopPercentGreaterThan70.png`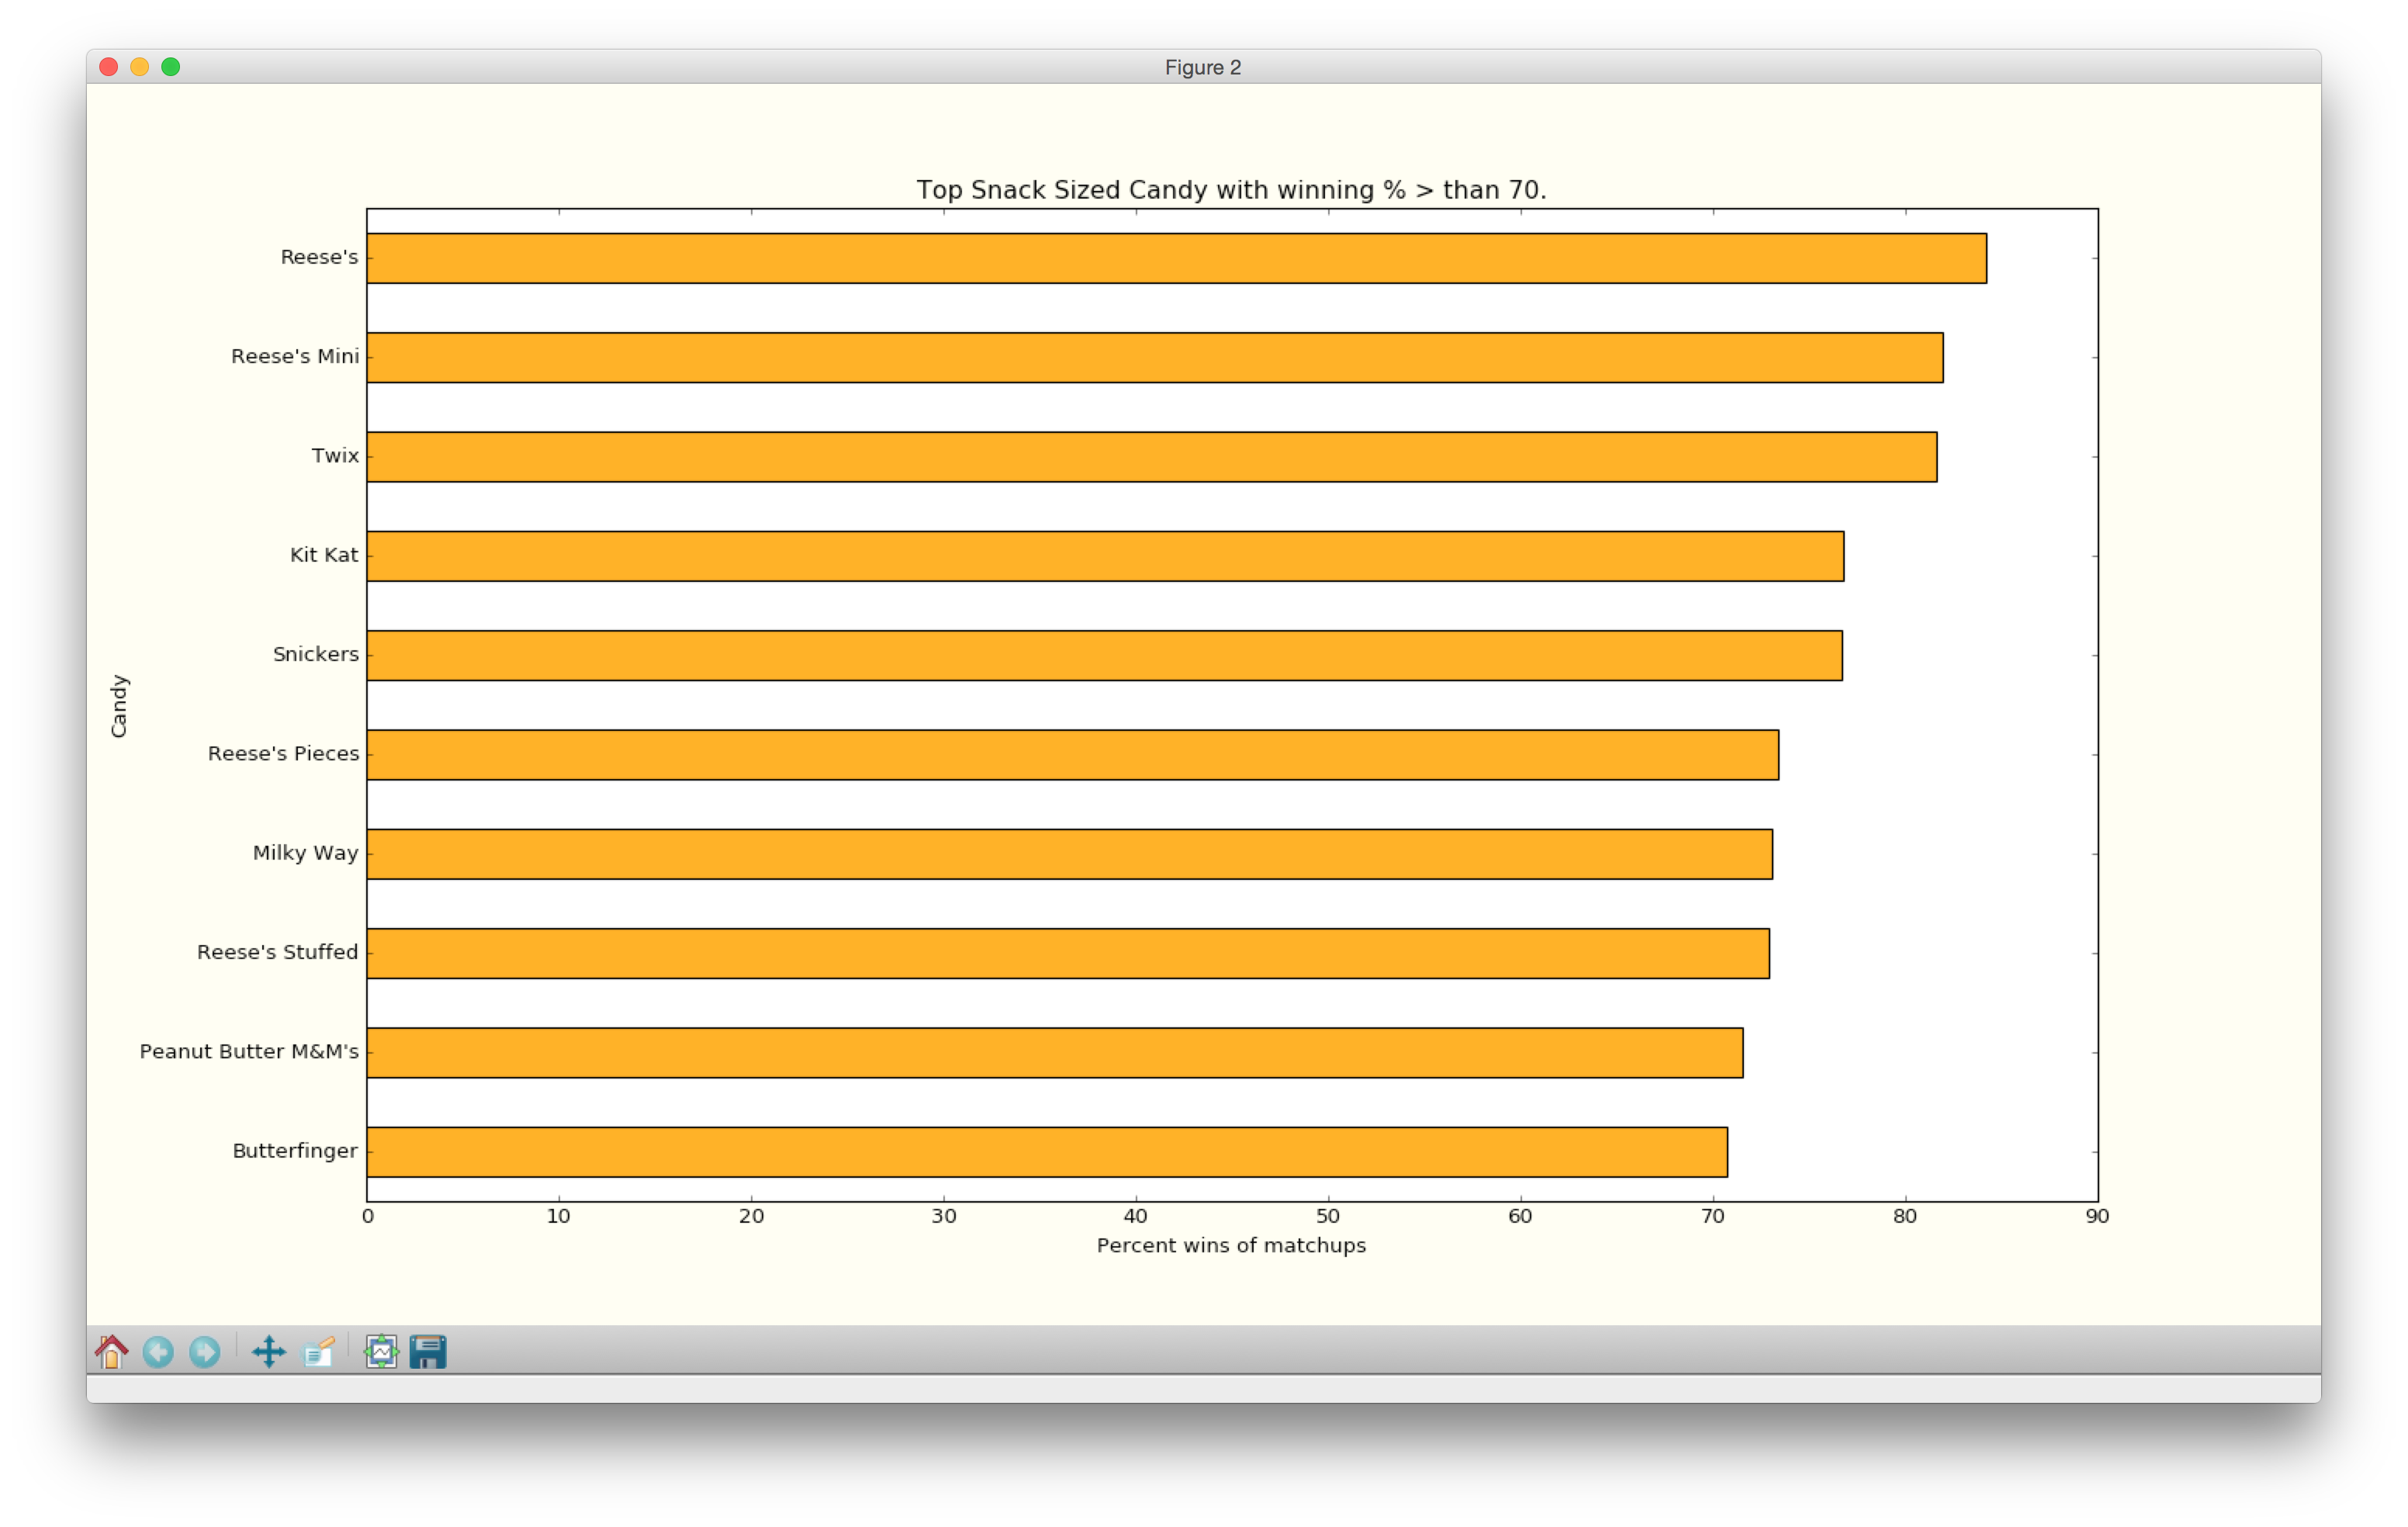
Example 2iii
makeCandyPlotByPercentage(candy,50)
# saves the plot in a file called `candyTopPercentGreaterThan50.png`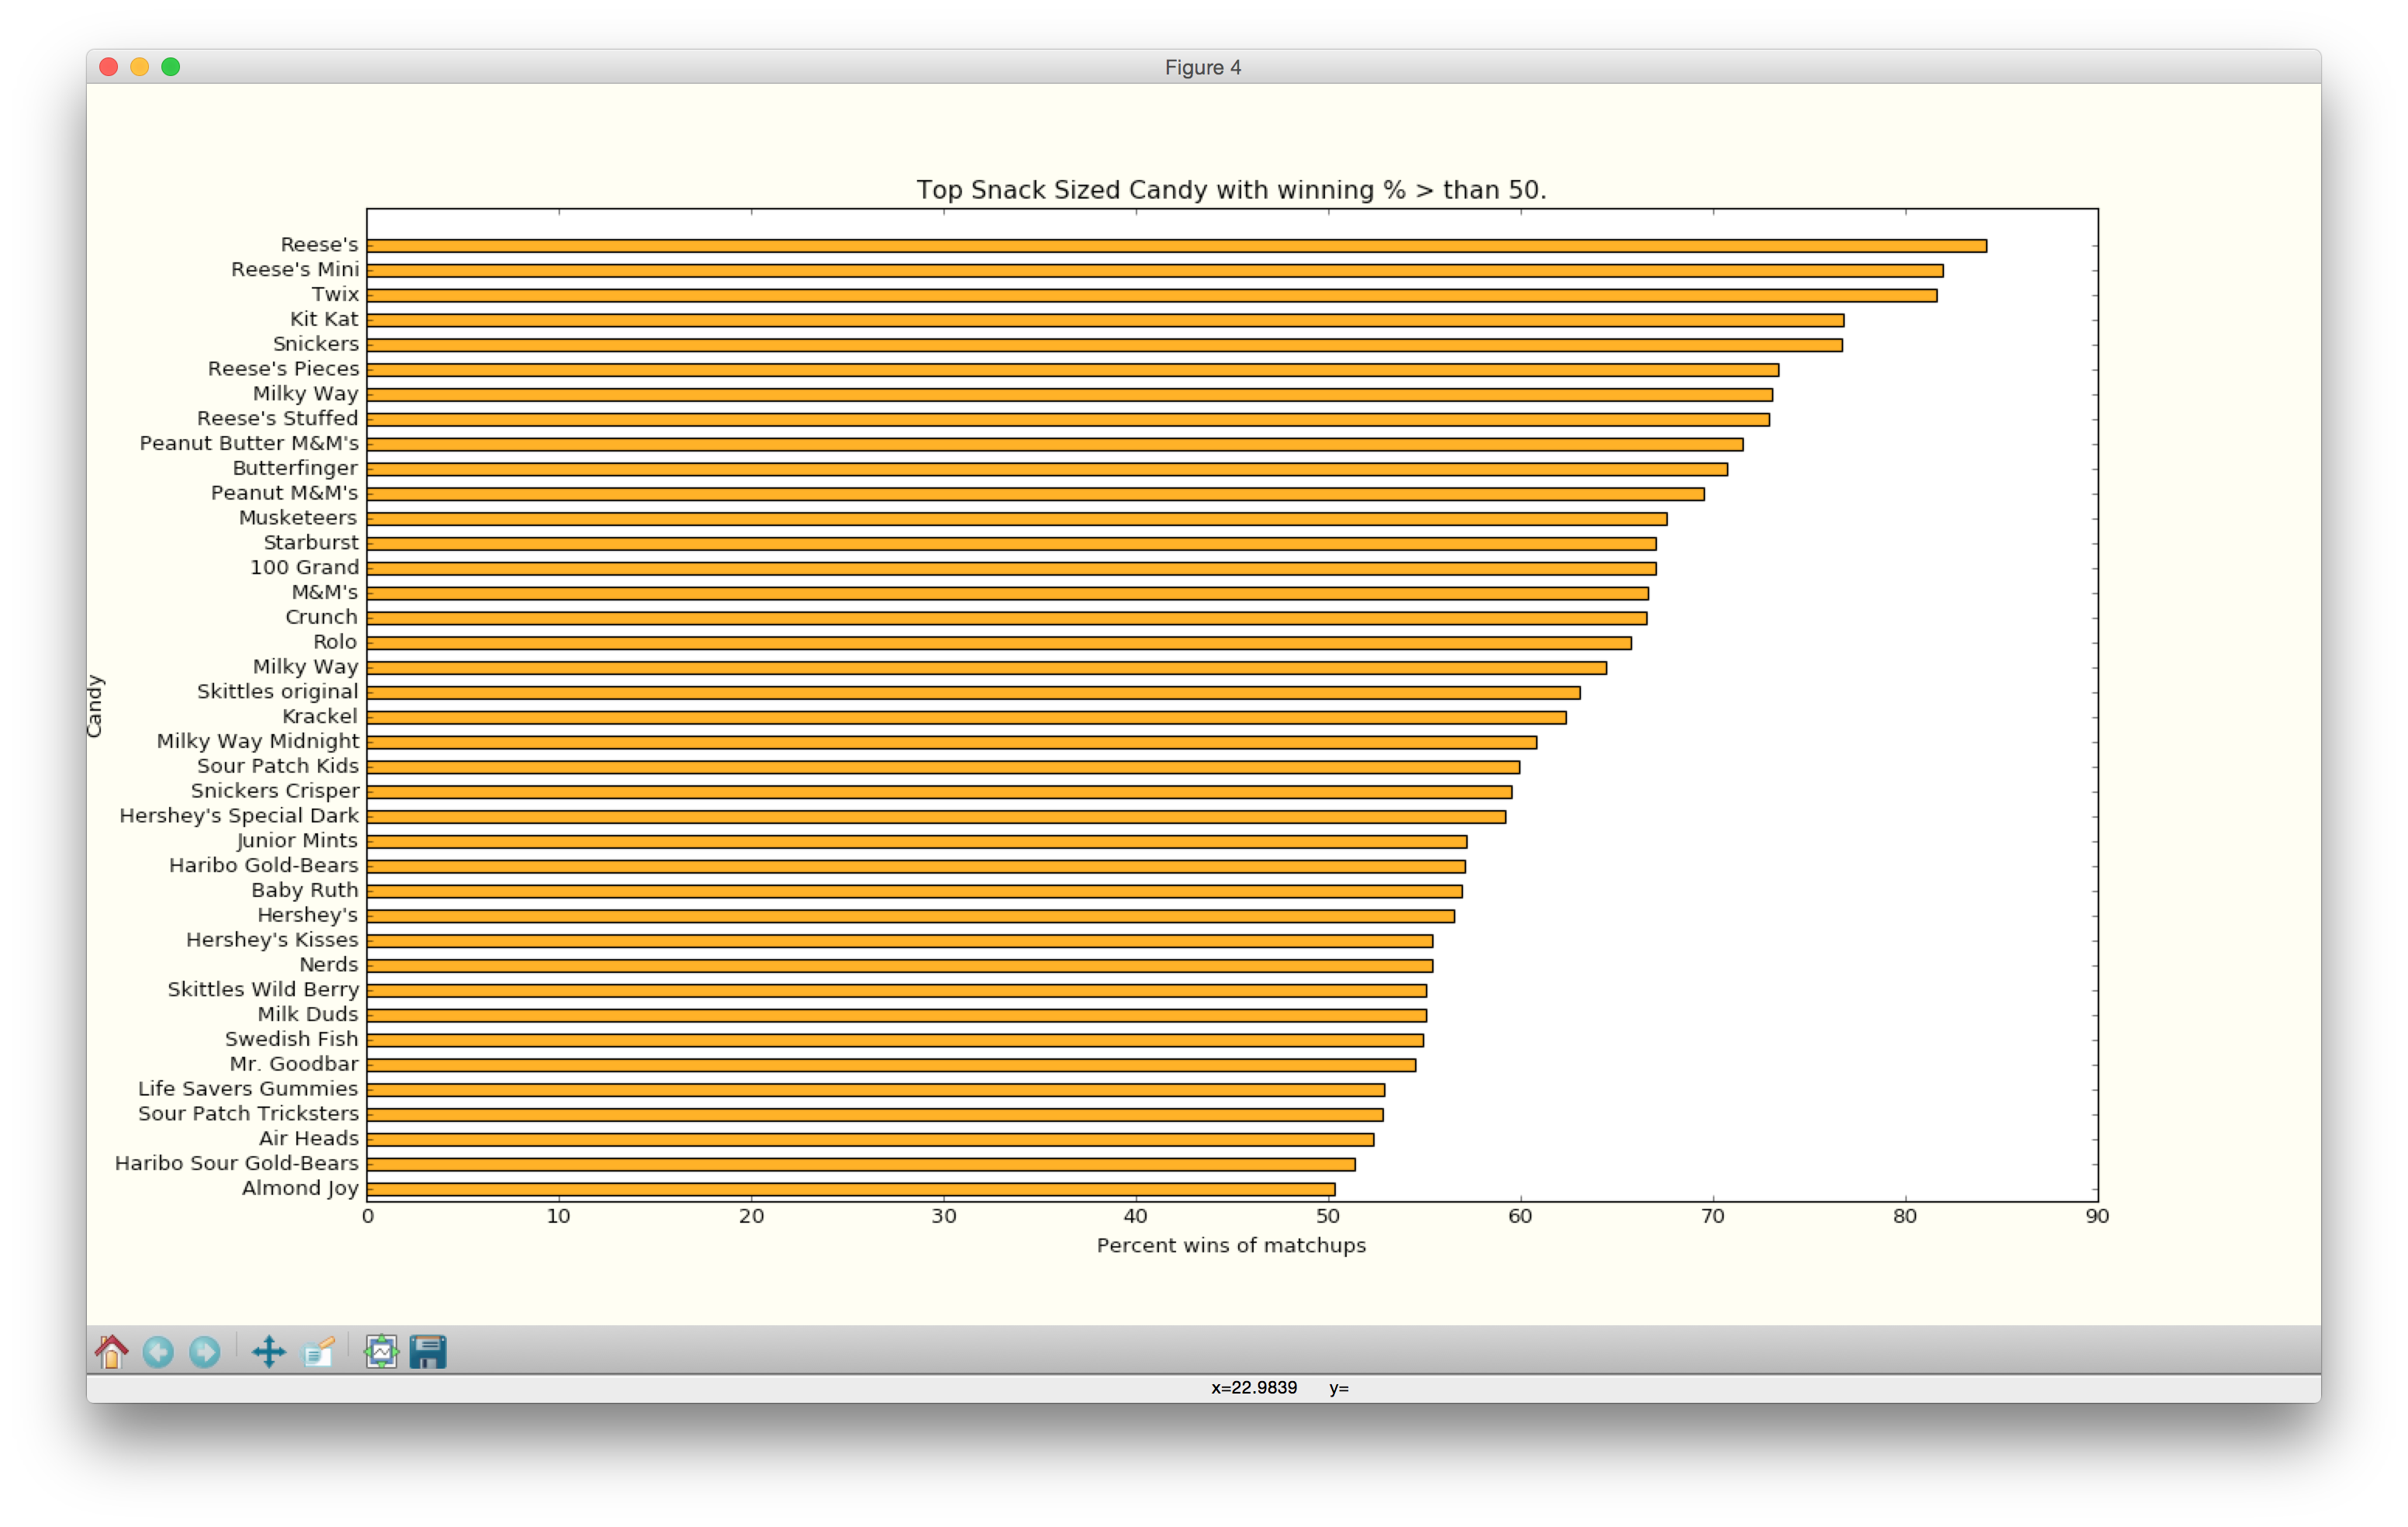
Task 2b: Verify that plots are created
Check your lab09 folder to make sure that the corresponding plots were created there (e.g. candyTopPercentGreaterThan50.png, and others).
Table of Contents
- How to Plot Home
- Part 1: Intro to plotting
- Part 2: Baby name bar plots
- Part 3: Candy Power Rankings
- Part 4: Baby name pie charts
- Reference: matplotlib colors
- Reference: Simple bar chart examples
- Reference: How to make a pie chart
- Reference: Plotting examples