Lab 2: Debugging in Thonny
Thonny has a "debugger," which lets us walk through our program step-by-step to actually see what it is doing. At the top of the Thonny window, next to the run button, you will see a series of buttons that look like this:

To activate the debugger, simply click on the button that looks like a bug (the creepy-crawly kind), instead of the normal run button. When you do that, the buttons will change so that they look like this:

These buttons allow you to control the flow of the program step-by-step, and Thonny will show you exactly what is happening by highlighting the part of the code being evaluated. Note that it can only debug a program (in the top window), not code in the shell (the bottom window).
Also note that if you're doing a screen share and only sharing the Thonny window, your partner will not be able to see the debugging information, and you'll have to share your whole desktop to get things working.
Try it out
Create a new file called debugger.py in your lab02 folder.
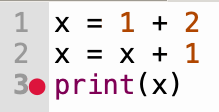
Make it look like this:
x = 1 + 2
x = x + 1
print(x)
Make sure you save it as debugger.py in your cs111 folder on your Desktop.
Now, click the debug button and then use the "step into" button (the middle yellow button with an arrow pointing down between two lines) to go through the steps of this program.
Before you step through it completely, take a guess at how many steps are in this program (it's more than you might think).
Click here to show the answer
You have to click 22 times to run the whole program, although some of those pauses are just to show you what will happen next. Operations like addition, variable assignment, and even the confirmation of individual values are all steps of the program.
The next time you're stuck on something in a problem set, try using the debugger to see what's happening in detail.
Breakpoints
Since programs have so many steps, it may take a while to get to the part
of your code that you're interested in when debugging. To speed things
up, you can set a "breakpoint" by clicking on the left-hand margin where
the line numbers are. A red dot will appear in the margin near whichever
line you clicked on (as long as it wasn't a comment or a blank line where
there isn't any code). If you set a breakpoint on line 3 of debugger.py
it will look like this:
Now, if you run in debug mode, it will fast forward straight to that line of code, and if you use the "Resume" button while debugging, it will also stop as soon as it gets to any line of code with a breakpoint on it. To remove a breakpoint, simply click the line number again.
The debugger has other features, like showing the value of variables in a function call frame, and we'll come back to it later in the course.