
Reading/Documentation
- Think Python, Chapter 10: Lists
- Think Python, Chapter 11: Dictionaries
- Python documentation on dictionary operations
- matplotlib gallery
- matplotlib plotting commands
- matplotlib examples
About this Problem Set
This problem set is intended to give you practice with dictionaries and their methods, list comprehension, reading from files, and plotting data with matplotlib.
- In Task 1 (Guided Task), you will write a program that makes use of dictionaries.
- In Task 2 (Guided Task), you will write a program to generate a path on a Google Map by building a URL, as well as perform some data analysis using list comprehension and other dict/list/string operations.
- In Task 3 (Partner Task), you will perform data analysis and plotting. Use this shared Google Doc to find a pair programming partner and record who your pair partner is. Remember that you can work with the same partner a maximum of TWO times this semester.
- Last semester all these tasks were more challenging than this semester. We have simplified each of them, thus, the times from last semester are not a good estimate of the time you might spend.
- All code for this assignment is available in the
ps06folder in thecs111/downloaddirectory within yourcsserver account. - Guidelines for checking the correctness and quality of your solution are here.
Task 1: Unjumbler
This is a guided problem which you must complete on your own, but for which you may ask for help from the CS111 staff.
Word Jumble is a popular game that appears in many newspapers and online. The game involves "unjumbling" English words whose letters have been reordered. For instance, the jumbled word ytikt can be unjumbled to kitty. Here is one version of the online game.

In this problem, you will create a Python program that is able to successfully unjumble jumbled words. Your program will start with a file of English words: a) for each word in the file, it will convert that word to an unjumble key by sorting the lowercase versions of the characters of the word in alphabetical order. For instance, the unjumble key for 'regal' would be 'aeglr'; b) it will create an unjumble dictionary that associates each such unjumble key with a list of all words that have the same unjumble key. For example, the unjumble dictionary will associate the unjumble key 'aeglr' with the list of words ['glare', 'lager', 'large', 'regal']; c) finally, to unjumble a string you simply convert it to its unjumble key and look that up in the unjumble dictionary. For example, to unjumble 'rgael', you convert it to its key 'aeglr', and look this up in the unjumble dictionary to find that it unjumbles to any of the words in the list ['glare', 'lager', 'large', 'regal'].
To complete this task, you will need to define the following three functions
in the file unjumble.py, which you can find inside the Unjumbler folder within the
ps06 folder available from the download directory on the cs server.
unjumbleKeytakes a single argument, a string, and returns a string that is the unjumble key of its input --- i.e., a string consisting of the lowercase versions of all characters of the string in alphabetical order. For example,In[1]: unjumbleKey('argle')
Out[1]: 'aeglr'
In[2]: unjumbleKey('regal')
Out[2]: 'aeglr'
In[3]: unjumbleKey('Star')
Out[3]: 'arst'
In[4]: unjumbleKey('histrionics')
Out[4]: 'chiiinorsst'
Notes
- When applied to a string, the
sortedfunction returns a list of the characters in sorted order:In[4]: sorted('abracadabra')
Out[4]: ['a','a','a','a','a','b','b','c','d','r','r']
- The
joinmethod of string values can be used to glue a list of strings together, using the string to whichjoinis applied as a separator.In[5]: ':'.join(['bunny','cat','dog'])
Out[5]: 'bunny:cat:dog'
In[6]: ' '.join(['bunny','cat','dog'])
Out[6]: 'bunny cat dog'
In[7]: ''.join(['bunny','cat','dog'])
Out[7]: 'bunnycatdog'
- When applied to a string, the
makeUnjumbleDictionarytakes a single argument, the name (a string) of a wordlist file that has one word per line, and returns a dictionary that associates the unjumble key of every word in the wordlist with the list of all words with that unjumble key. All words in the same list are anagrams --- i.e., words that all have exactly the same letters (including repeated ones), but in different orders.The
Unjumblerfolder in theps06folder contains three wordlist files:tinyWordList.txt(33 words),mediumWordList.txt(45,425 words), andlargeWordList.txt(438,712 words), For example, the filetinyWordList.txtcontains the following words:alerting altering arts caster caters crates glare histrionics integral lager large rats reacts recast regal relating restrain retrains opts post pots spot star strainer stop tars terrains traces triangle trichinosis tops tsar
The invocation of
makeUnjumbleDictionaryon this file should return a dictionary with 7 key/value items:In[8]: tinyDict = makeUnjumbleDictionary('tinyWordList.txt')
In[9]: tinyDict
Out[9]:

{'acerst':['caster','caters','crates','reacts','recast','traces'],

'aegilnrt':['alerting','altering','integral','relating','triangle'],

'aeglr':['glare','lager','large','regal'],

'aeinrrst':['restrain','retains','strainer','terrains','trainers'],

'arst':['arts','rats','star','tars','tsar'],

'chiiinorsst':['histrionics','trichinosis'],

'opst':['opts','post','pots','spot','stop','tops']}
In[10]: mediumDict = makeUnjumbleDictionary('mediumWordList.txt')
In[11]: print "len of mediumDct:", len(mediumDct)
len of mediumDct: 42273
In[12]: largeDct = makeUnjumbleDictionary("largeWordList.txt")
In[13]: print "len of largeDct:", len(largeDct)
len of largeDct: 386268
Notes:
- Create a helper function to read words from the file and return a list of words as strings. This way, your code becomes more modular and the readability is improved.
- In order to check if a key
kis in a dictionaryd, use the expressionk in dand notk in d.keys(). The latter expression creates a new list of keys every time it is evaluated, and can cause extremely slow behavior for large word lists. - Only print the length of the two other dictionaries, not their content, because it's huge.
unjumbletakes an unjumble dictionary (created bymakeUnjumbleDictionary) and a string and returns a list of all words in the dictionary to which the input string unjumbles. If there are no such words, it returns the empty list. For example,In[14]: tinyDict = makeUnjumbleDictionary('tinyWordList.txt')
In[15]: unjumble(tinyDict, 'esrat')
Out[15]: []
In[16]: mediumDct = makeUnjumbleDictionary("mediumWordList.txt")
In[17]: unjumble(mediumDct, 'esrat')
Out[17]: ['aster', 'rates', 'stare', 'tears']
In[18]: largeDct = makeUnjumbleDictionary("largeWordList.txt")
In[19]: unjumble(largeDct, 'esrat')
Out[19]: ['arest', 'arets', 'aster', 'astre', 'earst', 'rates', 'reast', 'resat', 'serta', 'stare', 'stear', 'strae', 'tares', 'tarse', 'taser', 'tears', 'teras']
For fun, use your unjumble function as an assistant in playing
the online game.
Task 2: Location Tracker
This is a guided problem which you must complete on your own, but for which you may ask for help from the CS111 staff.
Many fitness trackers or GPS devices generate tracks, where each track represents the path you took during some activity (e.g., taking a walk, riding a bike, driving a car) as timestamped sequence of locations that you traveled through. This data can be stored in a .csv (comma separated value) format, like the example in Lab 6 Part 2. Each line is a location entry with the following fields (in order):
- track ID: an integer identifying the track that the entry is part of
- a timestamp that specifies a date and time
- latitude
- longitude
Entries are in chronological order from earliest to latest. For example, here is a sample track with ID 4 consisting of nine entries that represent a walk from the Science Center to Paramecium Pond:
4,09/25/2015 06:01:07 PM,42.29408,-71.30208
4,09/25/2015 06:01:55 PM,42.29405,-71.30114
4,09/25/2015 06:02:47 PM,42.29405,-71.30029
4,09/25/2015 06:03:42 PM,42.2948,-71.29971
4,09/25/2015 06:04:53 PM,42.2953,-71.29925
4,09/25/2015 06:06:09 PM,42.29547,-71.30099
4,09/25/2015 06:07:13 PM,42.29549,-71.30237
4,09/25/2015 06:08:25 PM,42.29501,-71.30384
4,09/25/2015 06:09:41 PM,42.29493,-71.30498
There are many ways to analyze the data in such a track. For example, we might want to know the total distance traveled between the points of the track, the average speed, or an estimate of the number of calories burned during the walk. We can even use the Google Static Maps API to display the path of this track on a map, by generating a URL that embeds the latitude/longitude data:
https://maps.googleapis.com/maps/api/staticmap?size=600x600&markers=label:S|42.29408,-71.30208&markers=label:E|42.29493,-71.30498&path=42.29408,-71.30208|42.29405,-71.30114|42.29405,-71.30029|42.2948,-71.29971|42.2953,-71.29925|42.29547,-71.30099|42.29549,-71.30237|42.29501,-71.30384|42.29493,-71.30498
If you click on this URL (or copy it into a browser URL bar) you should see the following image:
We've given you a sample data file,
sampletracks.csv, containing 8 tracks whose entries are ordered by timestamp:
1,09/25/2015 06:23:01 PM,42.2941,-71.3019
1,09/25/2015 06:23:10 PM,42.29416,-71.30194
1,09/25/2015 06:24:12 PM,42.29404,-71.30106
...
6,09/29/2015 03:50:00 PM,42.20592,-71.2388
6,09/29/2015 03:50:19 PM,42.20449,-71.23774
7,09/29/2015 03:52:24 PM,42.29192,-71.303
7,09/29/2015 03:54:27 PM,42.2918,-71.30425
...
7,09/29/2015 05:31:24 PM,42.29106,-71.30122
8,09/29/2015 05:35:30 PM,42.20403,-71.23852
8,09/29/2015 05:36:53 PM,42.20501,-71.23873
...
8,09/29/2015 05:58:56 PM,42.22341,-71.22407
7,09/29/2015 06:20:39 PM,42.29256,-71.30184
...
7,09/29/2015 06:58:43 PM,42.29391,-71.30196
Note that entries from different tracks may be interleaved. For example, track 7 begins before track 8, but finishes after track 8.
We would like to write a program to read and analyze the tracks from such files. In particular, we're interested in generating the following statistics for any given track:
- the total distance traveled in the track
- the time that passed from the start to the end of the track
- the average speed during the track
- a visualization of the path of the track, expressed as a URL using the Google Static Maps API (as shown above).
To complete this task, you will flesh out the bodies of some functions in the file
analyzetracks.py in the Location subfolder.
After you do this, the program will be able to print out an analysis of a given track in any
file with the format described above.
For example, analyzing the track with ID = 4 in
sampletracks.csv should print:
TrackID: 4
Number of locations: 9
Total distance: 0.49 miles
Total time: 0.14 hours
Average speed: 3.46 miles per hour
Path URL: https://maps.googleapis.com/maps/api/staticmap?size=600x600&markers=label:S|42.29408,-71.30208&markers=label:E|42.29493,-71.30498&path=42.29408,-71.30208|42.29405,-71.30114|42.29405,-71.30029|42.2948,-71.29971|42.2953,-71.29925|42.29547,-71.30099|42.29549,-71.30237|42.29501,-71.30384|42.29493,-71.30498
and analyzing the track with ID = 5 should print:
TrackID: 5
Number of locations: 62
Total distance: 4.46 miles
Total time: 0.51 hours
Average speed: 8.69 miles per hour
Path URL: https://maps.googleapis.com/maps/api/staticmap?size=600x600&markers=label:S|42.20417,-71.23804&markers=label:E|42.20414,-71.23802&path=42.20417,-71.23804|42.20457,-71.23657|42.20434,-71.23506|42.20478,-71.23385|42.20568,-71.23345|42.20609,-71.23211|42.20549,-71.23119|42.20455,-71.23127|42.2035,-71.23155|42.20217,-71.23172|42.20139,-71.23238|42.20148,-71.23362|42.20072,-71.23429|42.20028,-71.23536|42.19946,-71.23592|42.19889,-71.23691|42.19863,-71.23813|42.19757,-71.23806|42.19659,-71.23863|42.19549,-71.23887|42.19458,-71.23862|42.19378,-71.23797|42.19343,-71.2368|42.1925,-71.2369|42.19125,-71.23647|42.19008,-71.2371|42.18914,-71.23675|42.18783,-71.2362|42.18655,-71.23632|42.18598,-71.23521|42.18505,-71.23462|42.18396,-71.23465|42.18516,-71.23464|42.1859,-71.23553|42.18578,-71.23689|42.18646,-71.23812|42.18753,-71.23766|42.18846,-71.23836|42.18964,-71.2384|42.19004,-71.23705|42.1908,-71.2363|42.19194,-71.23651|42.19283,-71.23682|42.19365,-71.2379|42.19346,-71.23924|42.19357,-71.24075|42.1945,-71.24153|42.19546,-71.24141|42.19633,-71.24108|42.19728,-71.23995|42.19835,-71.24009|42.19964,-71.23988|42.20097,-71.23974|42.20179,-71.23909|42.20275,-71.23918|42.20347,-71.24039|42.20425,-71.24165|42.20515,-71.24104|42.20607,-71.23975|42.20533,-71.23906|42.20474,-71.23781|42.20414,-71.23802
Begin this problem by studying analyzetracks.py. This contains the function
summarizeTrack, which has already been implemented, plus the contracts for four functions that you are required to flesh out:
-
readEntriesFromFile(filenames): usinglinesFromFile, parse the lines from a .csv file into a dictionary of lists of dictionaries, one list for each track. Returns this dict. -
trackDistance(entries): Returns the total distance in miles in the path of the track consisting of the given entries. trackTime(entries): Returns the total time in hours for the track consisting of the given entries.trackURL(entries): Returns a Google Static Maps URL that displays the track of this path and marks the locations of the first and last entries.
The function summarizeTrack prints out a summary of the given trackID by calling
the three of the functions. You needn't edit this function, but read it so that you understand what your functions should do.
We have provided several helper functions in the file tracksHelper.py that
significantly simplify this task. You do not have to understand how these functions work; you only have to understand what they do.
linesFromFileis the function encountered in lab and lecture that returns a list of stripped lines from a file.twoPointsDistancetakes two track entries (where each entry is a tuple of two float numbers) and returns the number of miles between their locations. For example:In [36]: twoPointsDistance((42.29408,-71.30208), (42.29405,-71.30114))Out[36]: 0.04808954510790279diffTimetakes two timestamp strings, and returns the number of seconds from the first to the second. For example:In [37]: diffTime('09/27/2015 05:39:31 PM', '09/27/2015 06:10:19 PM')Out[37]: 1848.0
Notes
- Function
readEntriesFromFileneeds to use aforloop, as well as the the methods:split,float, andappend. It invokeslinesFromFile. - Function
trackDistanceshould not use explicitforloops, instead, will use list comprehensions. It also needs the built-in functionszipandsum. - Function
trackTimeuses appropriate indexing to access the date values, and then invokes the functiondiffTime. It returns hours. - Function
trackURLuses the methodsjoin,str, and list comprehensions. No use of excplicit loops in this function either. - Uncomment the lines at the end of
analyzetracks.pyto test out your program on the provided data.
Task 3: The Titanic
This task (and only this task) is a partner problem in which you are required to work with a partner as part of a two-person team.
In this task, you will analyze data about passengers from the Titanic, a large ship that tragically sank in the waters of the North Atlantic Ocean in 1912. Passenger data can be found in the titanic.txt file provided
in the ps06/Titanic folder.
Study the structure of the data in titanic.txt. Then, study the code in
the file readtitanic.py, which reads the content of titanic.txt
and transforms it into a list of dictionaries, where every entry is a
passenger. Because the information for the passengers is incomplete, not all entries
have the same keys, see examples below:
In [24]: passengerList = createListOfTitanicPassengers('titanic.txt')

In [25]: len(passengerList)

Out[25]: 2208

In[26]: passengerList[2168]

Out[26]:

{'age': '31.0',

 'class': '1st Class',

 'group': 'Servant',

 'job': 'Personal Maid',

 'name': 'Miss Helen Alice Wilson',

 'status': 'survivor'}


In[27]: passsengerList[254]

Out[27]:

{'age': '30.0',

 'class': 'Engine',

 'job': 'Trimmer',

 'name': 'Mr Henry ("Harry") Brewer',

 'status': 'victim'}
Create a new file titanic.py, which imports the
passengerList from the file readtitanic.py.
In this file, you will write the function definitions that are described
in the following subtasks.
Task 3a: Cabin Class Survival
In this subtask, you'll create a dictionary that keeps track of the number of survivors and victims in every cabin class, in order to calculate the survival rate by cabin class. Below is the contract of the function you'll need to write.
  def createSurvivalDictionary(passengers):
    '''
    Given a list of passenger dictionaries, returns a dictionary
    whose keys are all the cabin classes that appear in passengers.
    The value associated with each cabin class name should
    itself be another dictionary that has three key/value pairs:
      (1) The key "survivors" maps to the number of survivors in
          that cabin class;
      (2) The key "victims" maps to the number of victims in that
          cabin class;
      (3) The key "survivalRate" maps to the survival rate in that
          cabin class (a floating point number rounded to 3 decimal
          digits)
      '''
Example input/output:
In[30]: createSurvivalDictionary(passengerList)
Out[30]:

{'1st Class': {'survivalRate': 0.62, 'survivors': 201, 'victims': 123},

 '2nd Class': {'survivalRate': 0.418, 'survivors': 119, 'victims': 166},

 '3rd Class': {'survivalRate': 0.254, 'survivors': 180, 'victims': 528},

 'A la Carte': {'survivalRate': 0.043, 'survivors': 3, 'victims': 66},

 'Deck': {'survivalRate': 0.652, 'survivors': 43, 'victims': 23},

 'Engine': {'survivalRate': 0.222, 'survivors': 72, 'victims': 253},

 'Victualling': {'survivalRate': 0.218, 'survivors': 94, 'victims': 337}}
Notes:
- The built-in function
set()can convert a list with duplicate elements into a set of unique elements. - An algorithm for solving this task would be: first find all the cabin classes (see
point above); then make a dictionary
that associates each cabin class with the mini-dictionary
{'survivors': 0, 'victims': 0}; and then iterate through the passenger list updating the mini-dictionary for the cabin class of each passenger. Once all the passengers have been processed, the correctsurvivalRatecan be added to each mini-dictionary based on the number of survivors and victims. - In Python, the name
classis a special keyword, so don't use it as a variable name.
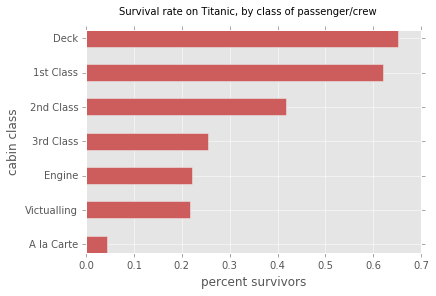
Task 3b: Horizontal Bar Chart of Survival Rates by Class
Implement the function barChartOfSurvivalRates which
will display a horizontal bar chart showing the percentage of
survivors by cabin class, in decreasing order by survival rate.
def barChartOfSurvivalRates(passengers):
    '''
    Given a list of passenger dictionaries, displays a horizontal
    bar chart of the sorted percentage of survival rates for each
    cabin class. A percentage value is a floating point number
    between 0 and 1.0.
    '''
Note:
- You should use
createSurvivalDictionaryfrom Task 2a as a helper function in the definition ofbarChartOfSurvivalRates(passengers). - Our solution generates the bar chart below. You are free to use different styling to display the information, as long as you fulfill the major requirements. The color of the bars is "indianred".
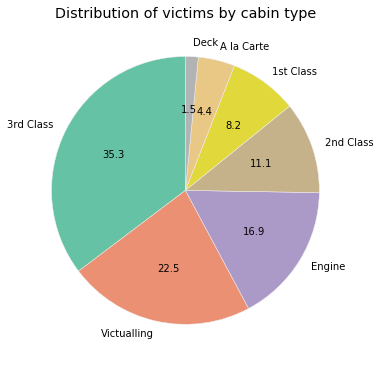
Task 3c: Pie Chart of Victims' Cabin Classes
Implement the function pieChartOfVictimsCabinClasses
which will display a pie chart showing the relative number of
Titanic victims from each cabin class.
def pieChartOfVictimsCabinClasses(passengers):
    '''
    Given a list of passenger dictionaries, displays a pie chart
    showing the relative number of victims from each cabin class.
    Pie slices should be labeled with the cabin names, and ordered
    clockwise from smallest pie slice to largest pie slice
    starting at 12 o'clock.
    '''
The following chart is the one generated by our solution. When you first create your pie chart it may not look like this. See notes for details how this was created.
Notes:
- You should invoke
createSurvivalDictionaryfrom Task 3a in the definition ofpieChartOfVictimsCabinClasses. Then using the values of survival dictionary, you will create a new dictionary that maps the cabin names to the victim counts. - To sort the labels (class cabins) by the victim counts you need to use
a strategy called decorate-sort-undecorate. Once you have sorted the pairs
of values+keys in this way, you unpair them into two separate lists to
pass to the
piefunction. - Use the statement
figure(1, figsize=(6,6), facecolor='white')before the call topiein order to get a circular pie instead of an oval pie. - We have used the parameter
startangleto control the ordering of slices. - We have used the parameter
autopctto display the percentage values within the pie slices. - We have used a colormap to generate a new list of colors for chart. This list is passed
to
piewith the named parametercolors. If you are interested in the names of color maps in matplotlib, consult this page. Below is our code, feel free to use a different colormap.colormap = plt.cm.Set2 # Set2 is the name of the colormap colors = colormap(np.linspace(0., 1., NRofSLICES))) # NRofSLICES needs to be replaced with code Soft-copy submission (every student)
Save all your modified files in the respective subfolders within Submit Honor Code for PS6 form (every student)
Fill out this form before 11:59pm on Sunday, March 13th, 2016. Failure to fill out the Honor Code form will result in zero credit for PS6.
How to turn in (2 separate steps)
ps06.
Submit the entire ps06 folder to
your drop folder on the cs server using FTP software (Fetch, WinSCP, CyberDuck, etc). Do NOT change the name of the ps06 folder.
You should submit this softcopy folder by
11:59pm on Sunday, Marth 13th, 2016. Failure to submit your code before the deadline will result in zero credit for PS6.